How-To: Observe metrics with Prometheus
Setup Prometheus Locally
To run Prometheus on your local machine, you can either install and run it as a process or run it as a Docker container.
Install
Note
You don’t need to install Prometheus if you plan to run it as a Docker container. Please refer to the Container instructions.To install Prometheus, follow the steps outlined here for your OS.
Configure
Now you’ve installed Prometheus, you need to create a configuration.
Below is an example Prometheus configuration, save this to a file i.e. /tmp/prometheus.yml or C:\Temp\prometheus.yml
global:
  scrape_interval:     15s # By default, scrape targets every 15 seconds.

# A scrape configuration containing exactly one endpoint to scrape:
# Here it's Prometheus itself.
scrape_configs:
  - job_name: 'dapr'

    # Override the global default and scrape targets from this job every 5 seconds.
    scrape_interval: 5s

    static_configs:
      - targets: ['localhost:9090'] # Replace with Dapr metrics port if not default
Run as Process
Run Prometheus with your configuration to start it collecting metrics from the specified targets.
./prometheus --config.file=/tmp/prometheus.yml --web.listen-address=:8080
We change the port so it doesn’t conflict with Dapr’s own metrics endpoint.
If you are not currently running a Dapr application, the target will show as offline. In order to start collecting metrics you must start Dapr with the metrics port matching the one provided as the target in the configuration.
Once Prometheus is running, you’ll be able to visit its dashboard by visiting http://localhost:8080.
Run as Container
To run Prometheus as a Docker container on your local machine, first ensure you have Docker installed and running.
Then you can run Prometheus as a Docker container using:
docker run \
    --net=host \
    -v /tmp/prometheus.yml:/etc/prometheus/prometheus.yml \
    prom/prometheus --config.file=/etc/prometheus/prometheus.yml --web.listen-address=:8080
--net=host ensures that the Prometheus instance will be able to connect to any Dapr instances running on the host machine. If you plan to run your Dapr apps in containers as well, you’ll need to run them on a shared Docker network and update the configuration with the correct target address.
Once Prometheus is running, you’ll be able to visit its dashboard by visiting http://localhost:8080.
Setup Prometheus on Kubernetes
Prerequisites
Install Prometheus
- First create namespace that can be used to deploy the Grafana and Prometheus monitoring tools
kubectl create namespace dapr-monitoring
- Install Prometheus
helm repo add prometheus-community https://prometheus-community.github.io/helm-charts
helm repo update
helm install dapr-prom prometheus-community/prometheus -n dapr-monitoring
If you are Minikube user or want to disable persistent volume for development purposes, you can disable it by using the following command.
helm install dapr-prom prometheus-community/prometheus -n dapr-monitoring
 --set alertmanager.persistence.enabled=false --set pushgateway.persistentVolume.enabled=false --set server.persistentVolume.enabled=false
For automatic discovery of Dapr targets (Service Discovery), use:
helm install dapr-prom prometheus-community/prometheus -f values.yaml -n dapr-monitoring --create-namespace
values.yaml File
alertmanager:
  persistence:
    enabled: false
pushgateway:
  persistentVolume:
    enabled: false
server:
  persistentVolume:
    enabled: false

# Adds additional scrape configurations to prometheus.yml
# Uses service discovery to find Dapr and Dapr sidecar targets
extraScrapeConfigs: |-
  - job_name: dapr-sidecars
    kubernetes_sd_configs:
      - role: pod
    relabel_configs:
      - action: keep
        regex: "true"
        source_labels:
          - __meta_kubernetes_pod_annotation_dapr_io_enabled
      - action: keep
        regex: "true"
        source_labels:
          - __meta_kubernetes_pod_annotation_dapr_io_enable_metrics
      - action: replace
        replacement: ${1}
        source_labels:
          - __meta_kubernetes_namespace
        target_label: namespace
      - action: replace
        replacement: ${1}
        source_labels:
          - __meta_kubernetes_pod_name
        target_label: pod
      - action: replace
        regex: (.*);daprd
        replacement: ${1}-dapr
        source_labels:
          - __meta_kubernetes_pod_annotation_dapr_io_app_id
          - __meta_kubernetes_pod_container_name
        target_label: service
      - action: replace
        replacement: ${1}:9090
        source_labels:
          - __meta_kubernetes_pod_ip
        target_label: __address__

  - job_name: dapr
    kubernetes_sd_configs:
      - role: pod
    relabel_configs:
      - action: keep
        regex: dapr
        source_labels:
          - __meta_kubernetes_pod_label_app_kubernetes_io_name
      - action: keep
        regex: dapr
        source_labels:
          - __meta_kubernetes_pod_label_app_kubernetes_io_part_of
      - action: replace
        replacement: ${1}
        source_labels:
          - __meta_kubernetes_pod_label_app
        target_label: app
      - action: replace
        replacement: ${1}
        source_labels:
          - __meta_kubernetes_namespace
        target_label: namespace
      - action: replace
        replacement: ${1}
        source_labels:
          - __meta_kubernetes_pod_name
        target_label: pod
      - action: replace
        replacement: ${1}:9090
        source_labels:
          - __meta_kubernetes_pod_ip
        target_label: __address__
- Validation
Ensure Prometheus is running in your cluster.
kubectl get pods -n dapr-monitoring
Expected output:
NAME                                                READY   STATUS    RESTARTS   AGE
dapr-prom-kube-state-metrics-9849d6cc6-t94p8        1/1     Running   0          4m58s
dapr-prom-prometheus-alertmanager-749cc46f6-9b5t8   2/2     Running   0          4m58s
dapr-prom-prometheus-node-exporter-5jh8p            1/1     Running   0          4m58s
dapr-prom-prometheus-node-exporter-88gbg            1/1     Running   0          4m58s
dapr-prom-prometheus-node-exporter-bjp9f            1/1     Running   0          4m58s
dapr-prom-prometheus-pushgateway-688665d597-h4xx2   1/1     Running   0          4m58s
dapr-prom-prometheus-server-694fd8d7c-q5d59         2/2     Running   0          4m58s
Access the Prometheus Dashboard
To view the Prometheus dashboard and check service discovery:
kubectl port-forward svc/dapr-prom-prometheus-server 9090:80 -n dapr-monitoring
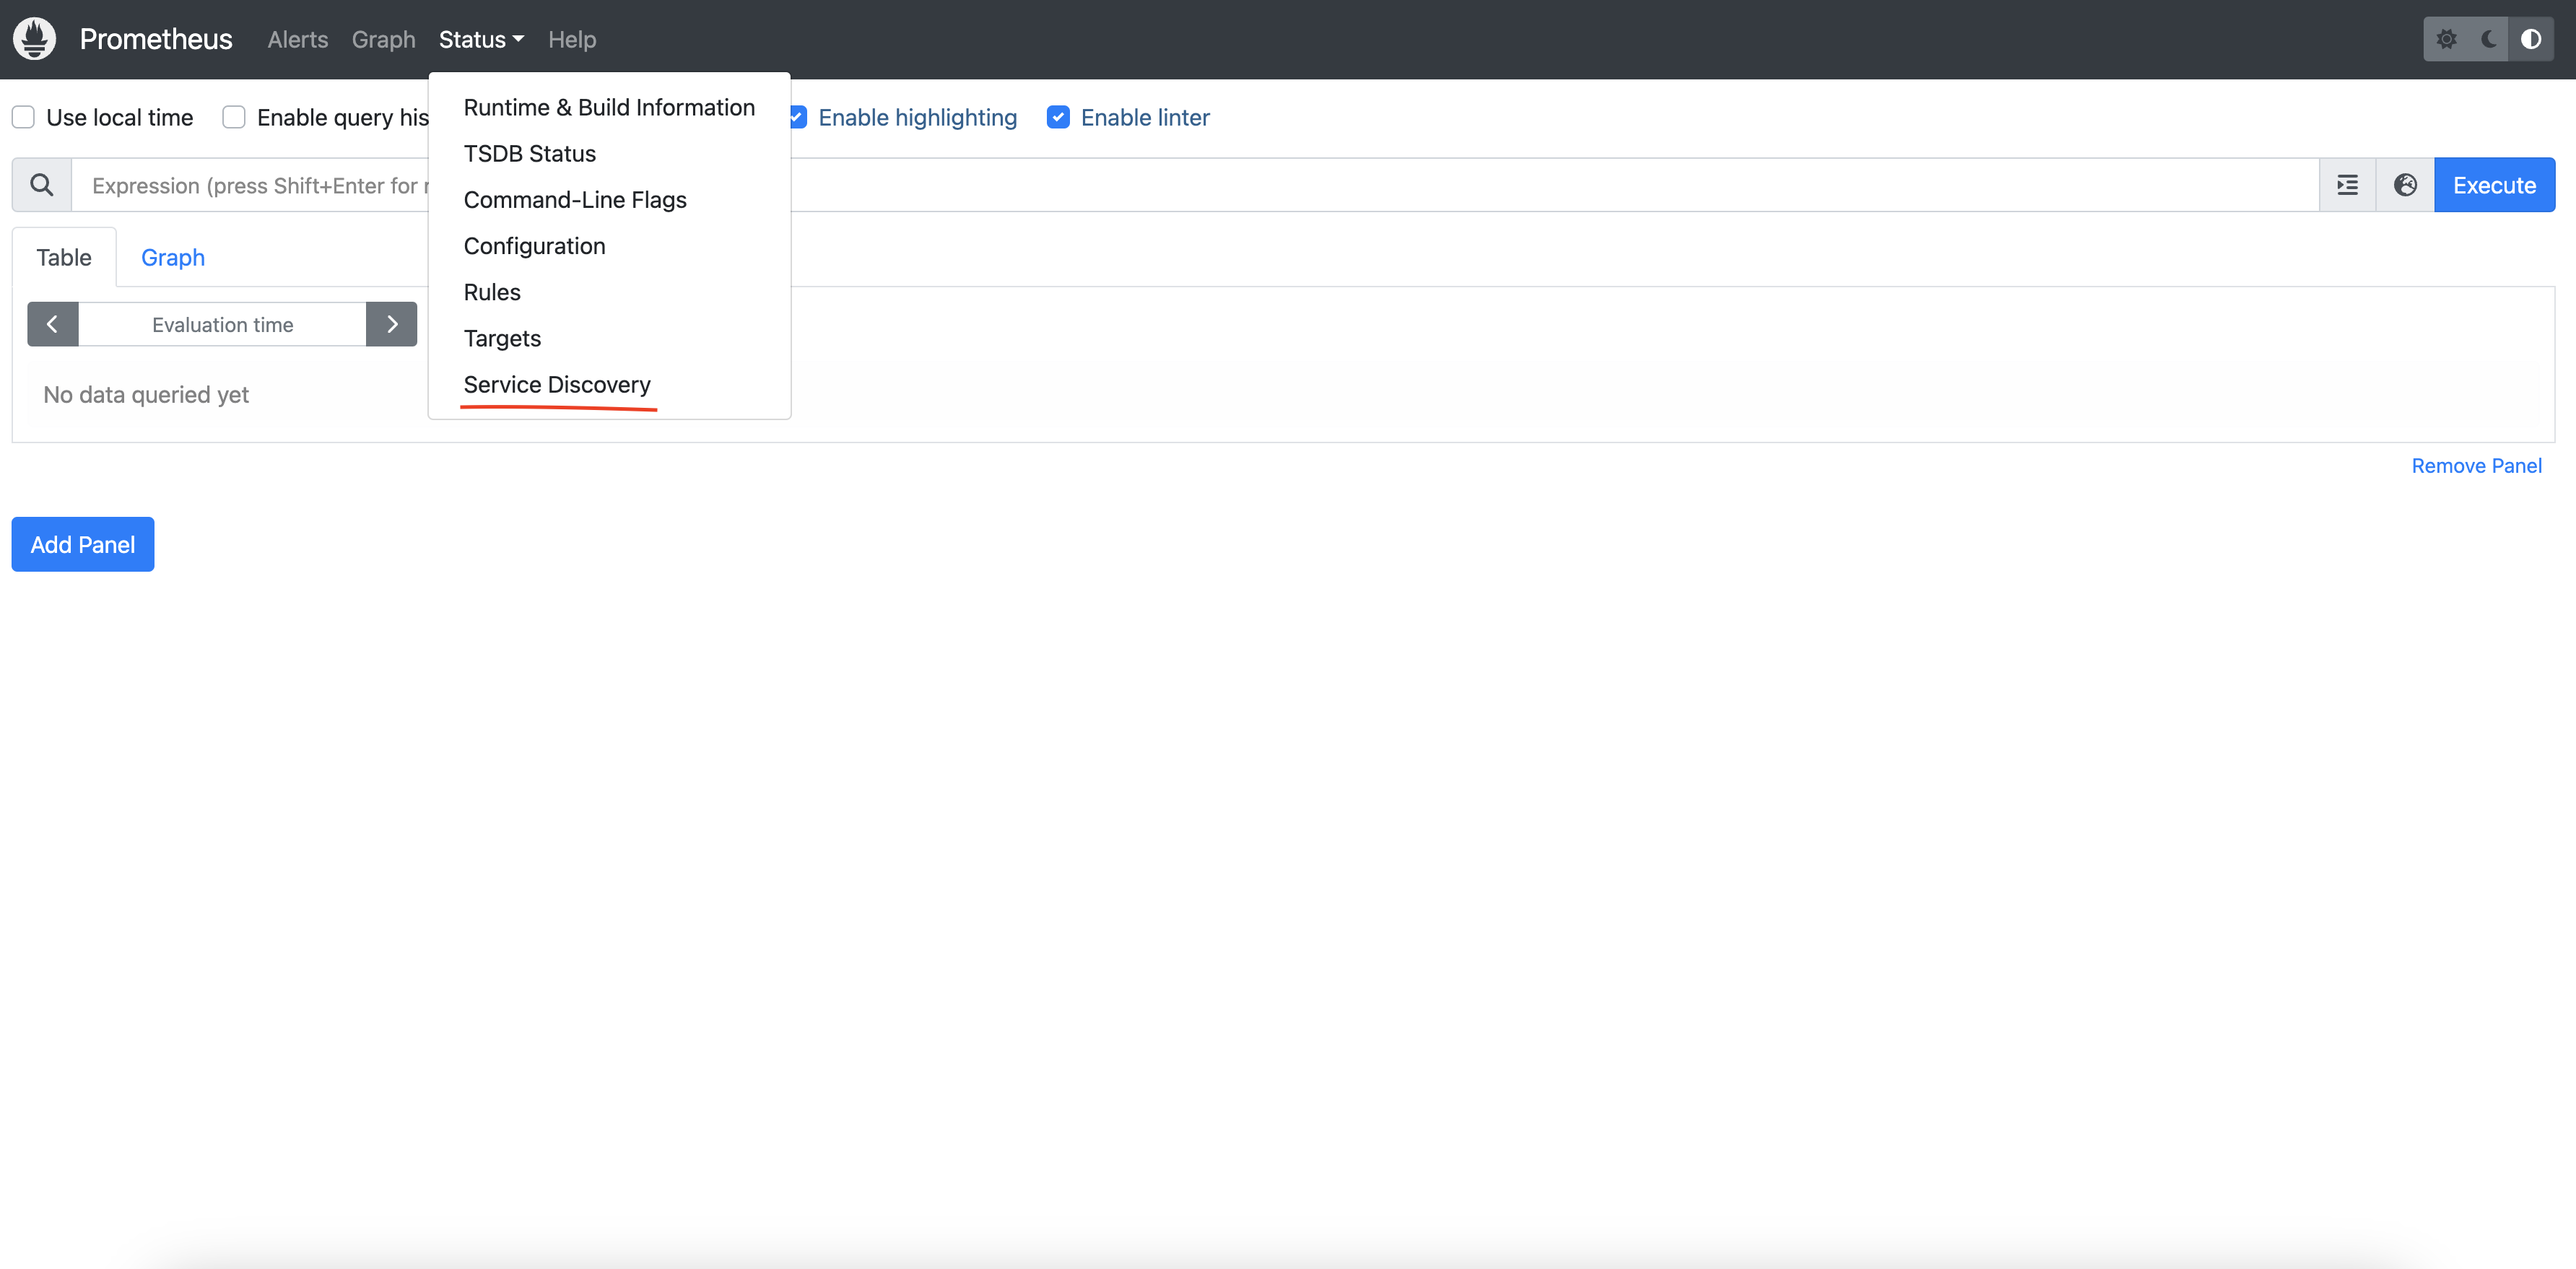
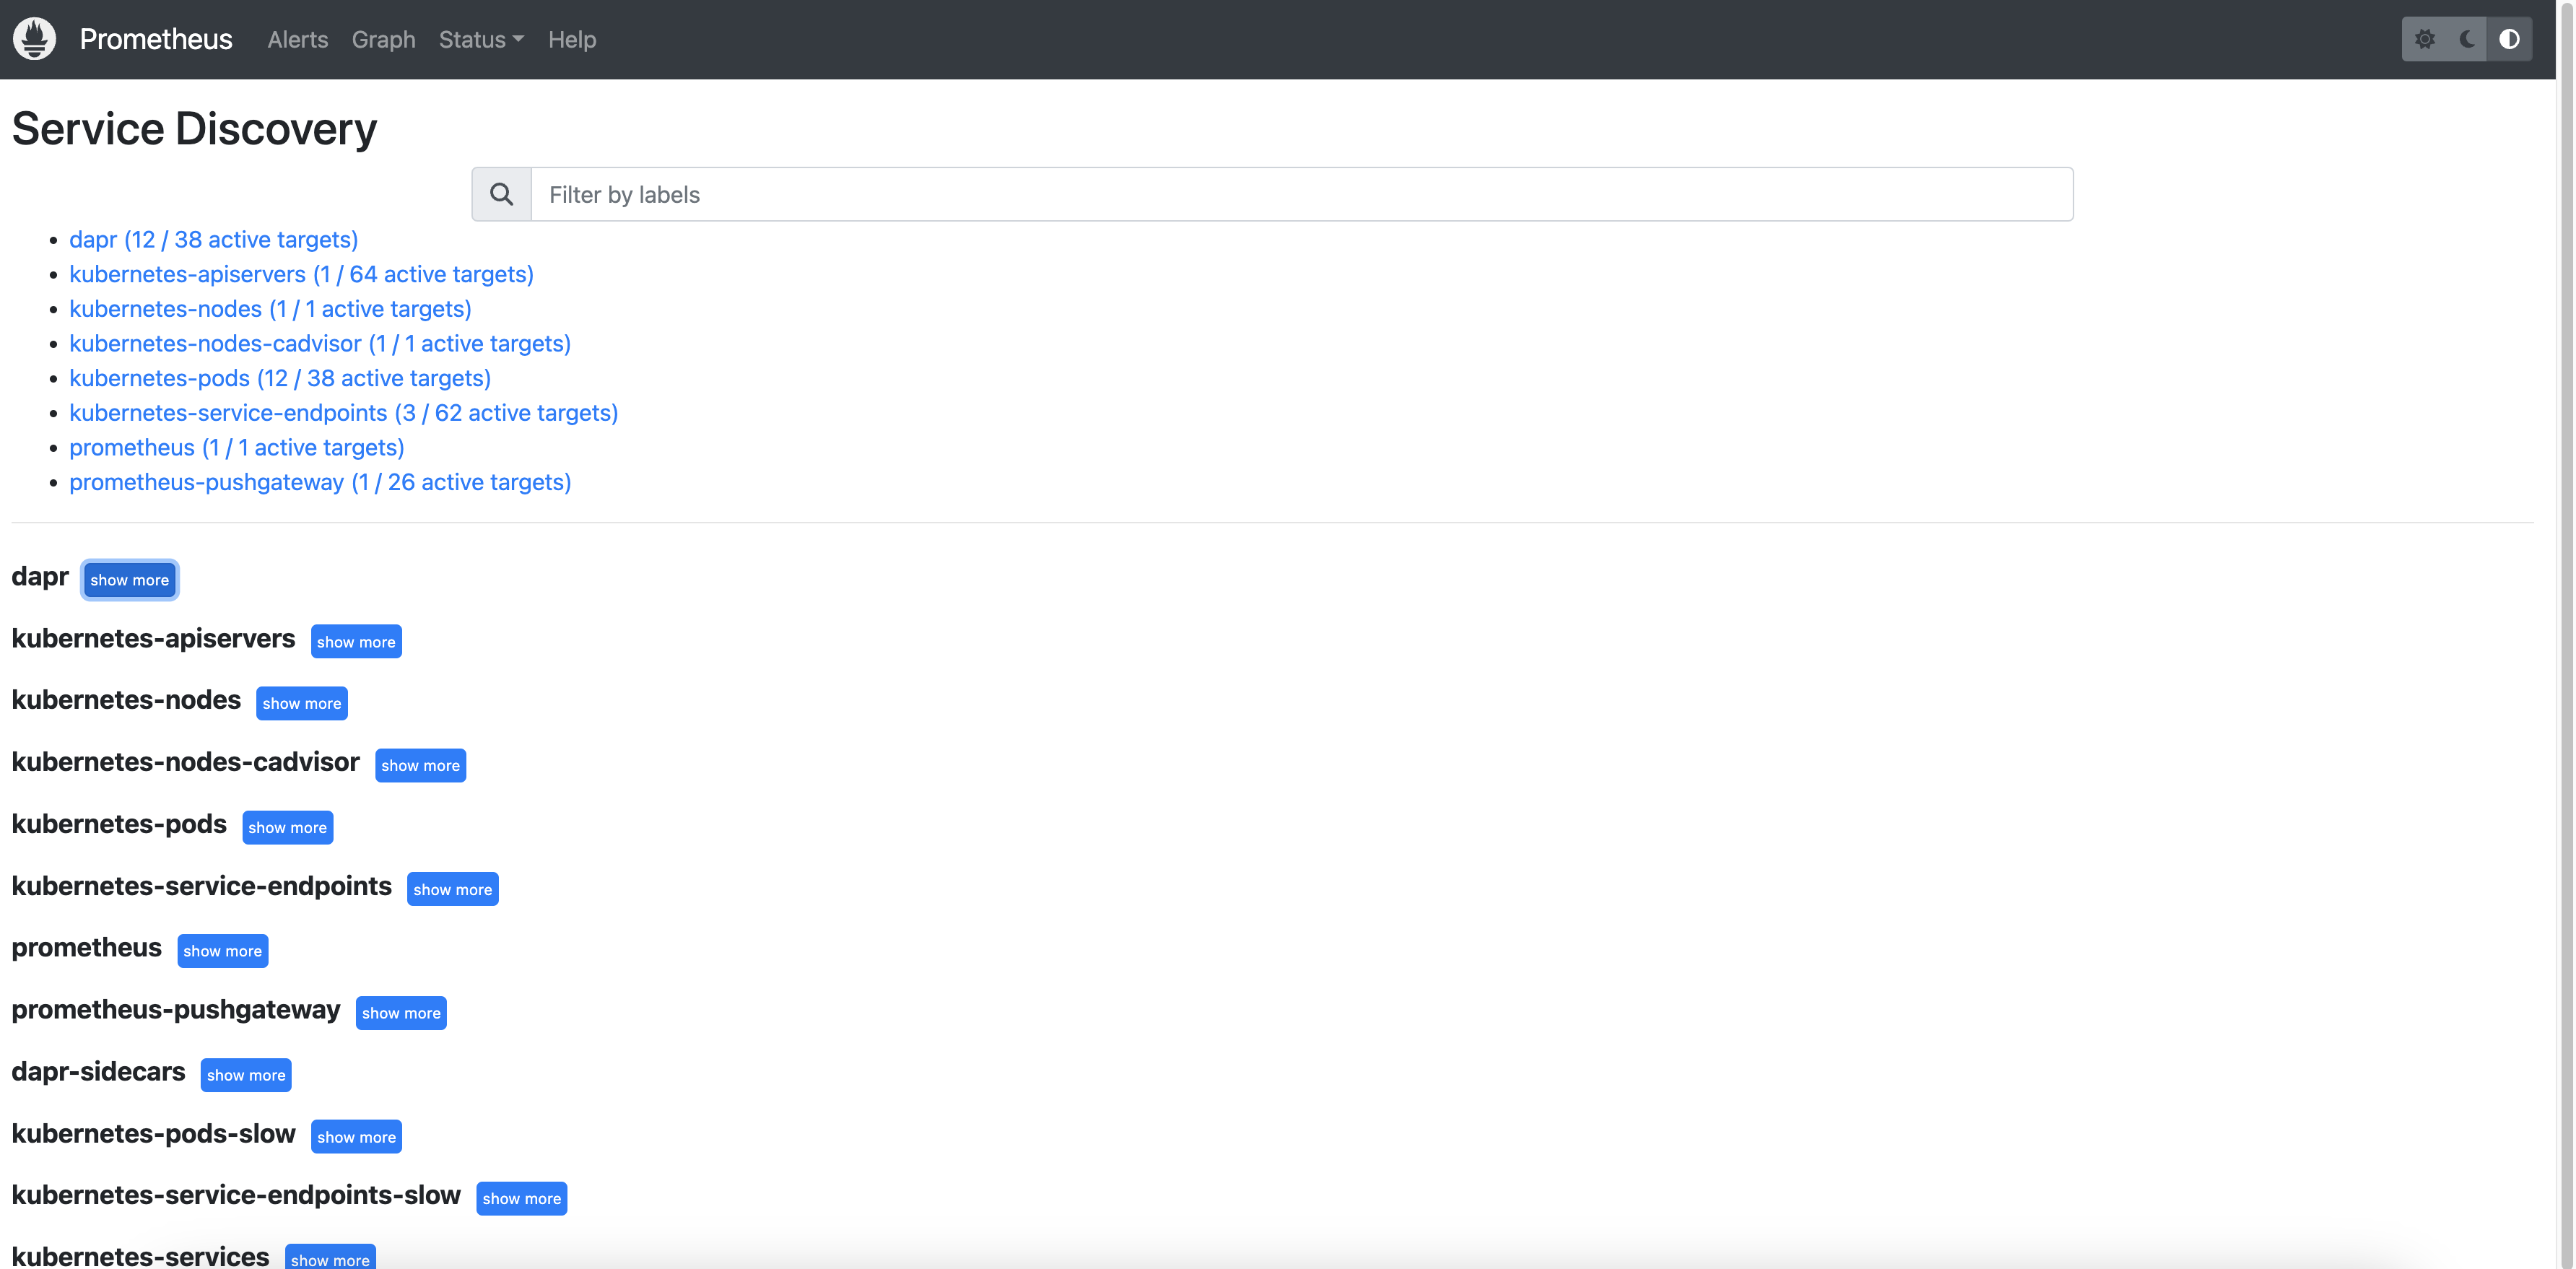
Open a browser and visit http://localhost:9090. Navigate to Status > Service Discovery to verify that the Dapr targets are discovered correctly.

You can see the job_name and its discovered targets.
