Observability
When building an application, understanding the system behavior is an important, yet challenging part of operating it, such as:
- Observing the internal calls of an application
- Gauging its performance
- Becoming aware of problems as soon as they occur
This can be particularly challenging for a distributed system comprised of multiple microservices, where a flow made of several calls may start in one microservice and continue in another.
Observability into your application is critical in production environments, and can be useful during development to:
- Understand bottlenecks
- Improve performance
- Perform basic debugging across the span of microservices
While some data points about an application can be gathered from the underlying infrastructure (memory consumption, CPU usage), other meaningful information must be collected from an “application-aware” layer – one that can show how an important series of calls is executed across microservices. Typically, you’d add some code to instrument an application, which simply sends collected data (such as traces and metrics) to observability tools or services that can help store, visualize, and analyze all this information.
Maintaining this instrumentation code, which is not part of the core logic of the application, requires understanding the observability tools’ APIs, using additional SDKs, etc. This instrumentation may also present portability challenges for your application, requiring different instrumentation depending on where the application is deployed. For example:
- Different cloud providers offer different observability tools
- An on-premises deployment might require a self-hosted solution
Observability for your application with Dapr
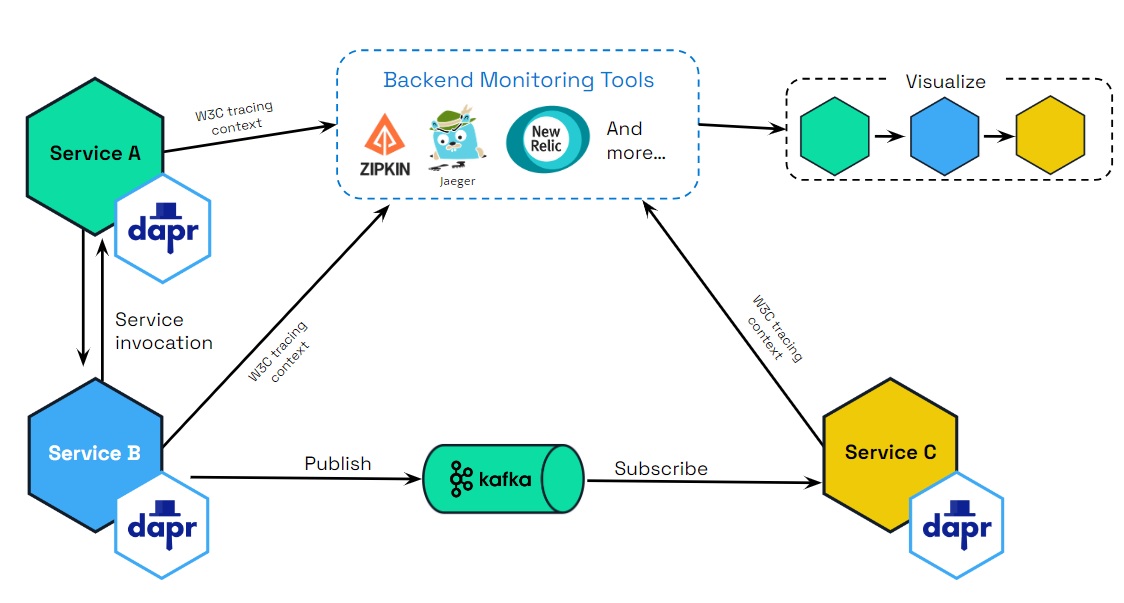
When you leverage Dapr API building blocks to perform service-to-service calls, pub/sub messaging, and other APIs, Dapr offers an advantage with respect to distributed tracing. Since this inter-service communication flows through the Dapr runtime (or “sidecar”), Dapr is in a unique position to offload the burden of application-level instrumentation.
Distributed tracing
Dapr can be configured to emit tracing data using the widely adopted protocols of Open Telemetry (OTEL) and Zipkin. This makes it easily integrated with multiple observability tools.
Automatic tracing context generation
Dapr uses the W3C tracing specification for tracing context, included as part Open Telemetry (OTEL), to generate and propagate the context header for the application or propagate user-provided context headers. This means that you get tracing by default with Dapr.
Observability for the Dapr sidecar and control plane
You can also observe Dapr itself, by:
- Generating logs emitted by the Dapr sidecar and the Dapr control plane services
- Collecting metrics on performance, throughput, and latency
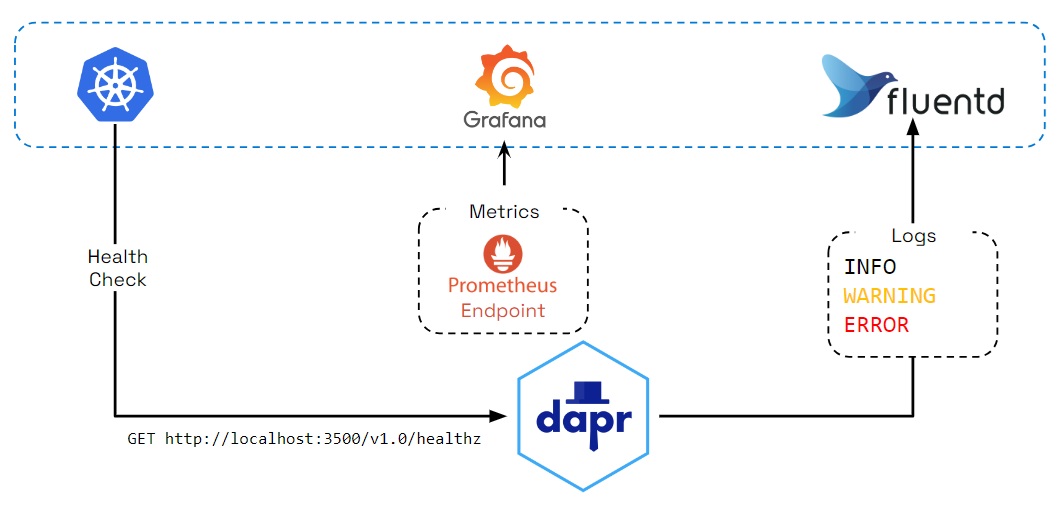
- Using health endpoints probes to indicate the Dapr sidecar health status
Logging
Dapr generates logs to:
- Provide visibility into sidecar operation
- Help users identify issues and perform debugging
Log events contain warning, error, info, and debug messages produced by Dapr system services. You can also configure Dapr to send logs to collectors, such as Open Telemetry Collector, Fluentd, New Relic, Azure Monitor, and other observability tools, so that logs can be searched and analyzed to provide insights.
Metrics
Metrics are a series of measured values and counts collected and stored over time. Dapr metrics provide monitoring capabilities to understand the behavior of the Dapr sidecar and control plane. For example, the metrics between a Dapr sidecar and the user application show call latency, traffic failures, error rates of requests, etc.
Dapr control plane metrics show sidecar injection failures and the health of control plane services, including CPU usage, number of actor placements made, etc.
Health checks
The Dapr sidecar exposes an HTTP endpoint for health checks. With this API, user code or hosting environments can probe the Dapr sidecar to determine its status and identify issues with sidecar readiness.
Conversely, Dapr can be configured to probe for the health of your application, and react to changes in the app’s health, including stopping pub/sub subscriptions and short-circuiting service invocation calls.