使用 OpenTelemetry Collector 收集追踪数据
如何使用 Dapr 通过 OpenTelemetry Collector 推送追踪事件。
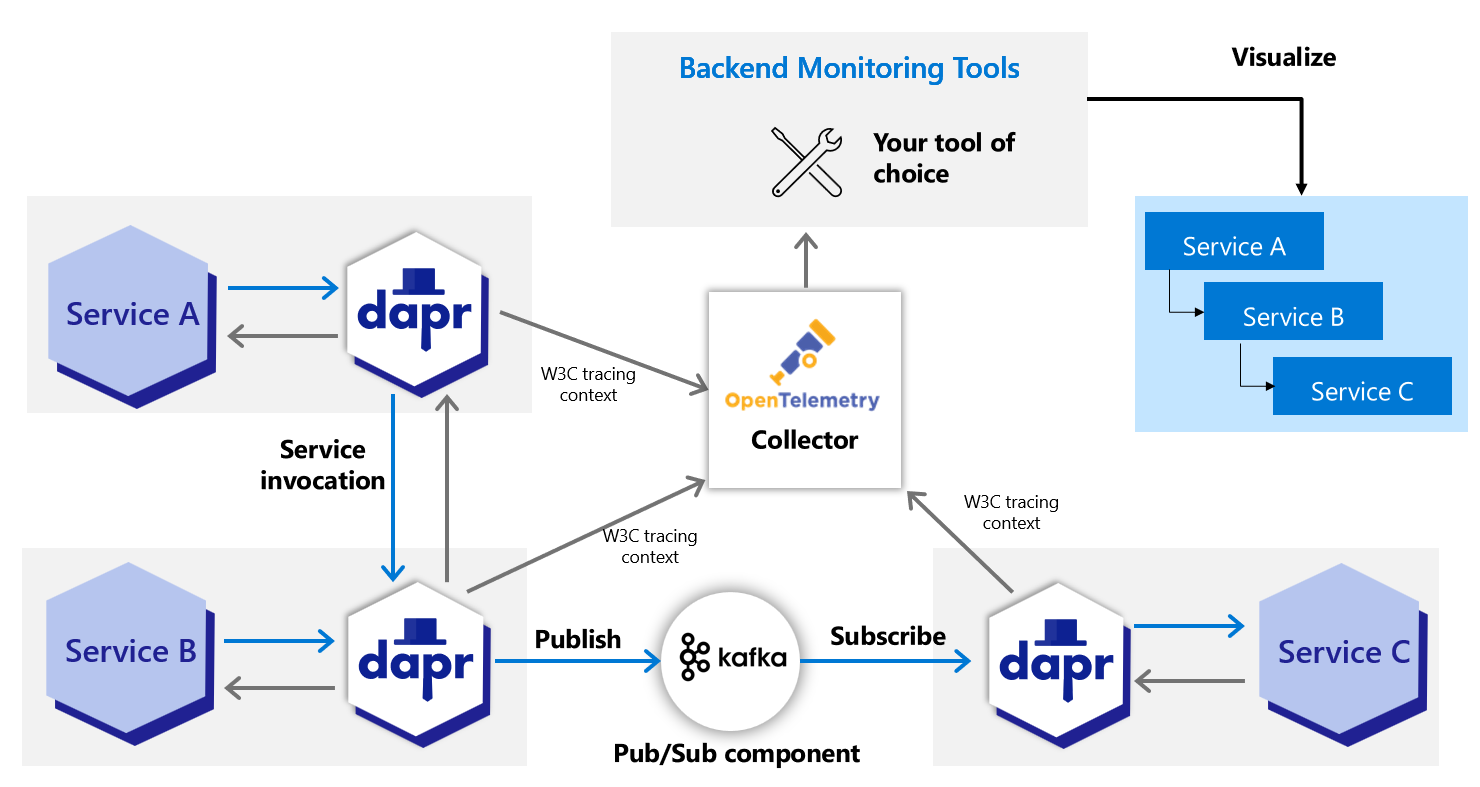
Dapr 使用 OpenTelemetry (OTLP) 协议直接写入追踪数据,这是推荐的方法。对于直接支持 OTLP 的可观测性工具,建议使用 OpenTelemetry Collector,因为它允许应用程序快速卸载数据,并包含重试、批处理和加密等功能。更多信息,请阅读 OpenTelemetry Collector 文档。
Dapr 也可以使用 Zipkin 协议写入追踪数据。在支持 OTLP 协议之前,Zipkin 协议与 OpenTelemetry Collector 一起使用,将追踪数据发送到 AWS X-Ray、Google Cloud Operations Suite 和 Azure Monitor 等可观测性工具。两种协议方法都是有效的,但 OpenTelemetry 协议是推荐的选择。
前提条件
- 在 Kubernetes 上安装 Dapr
- 验证您的追踪后端已设置好接收追踪数据
- 查看您的 OTEL Collector exporter 所需的参数:
设置 OTEL Collector 以推送到您的追踪后端
将
<your-exporter-here>部分替换为您的追踪 exporter 的正确设置。- 参考前提条件部分中的 OTEL Collector 链接来确定正确的设置。
使用以下命令应用配置:
kubectl apply -f open-telemetry-collector-generic.yaml
设置 Dapr 以将追踪数据发送到 OTEL Collector
设置一个 Dapr 配置文件来启用追踪,并部署一个使用 OpenTelemetry Collector 的追踪 exporter 组件。
使用此
collector-config.yaml文件创建您自己的配置。使用以下命令应用配置:
kubectl apply -f collector-config.yaml
使用追踪功能部署您的应用
通过在要参与分布式追踪的容器上添加 dapr.io/config 注解来应用 appconfig 配置,如下例所示:
apiVersion: apps/v1
kind: Deployment
metadata:
  ...
spec:
  ...
  template:
    metadata:
      ...
      annotations:
        dapr.io/enabled: "true"
        dapr.io/app-id: "MyApp"
        dapr.io/app-port: "8080"
        dapr.io/config: "appconfig"
您可以同时注册多个追踪 exporter,追踪日志会转发到所有已注册的 exporter。
就这样!无需包含任何 SDK 或检测您的应用程序代码。Dapr 会自动为您处理分布式追踪。
查看追踪数据
部署并运行一些应用程序。等待追踪数据传播到您的追踪后端,然后在那里查看它们。