使用 OpenTelemetry 向 Jaeger V2 发送 traces
Dapr 支持使用 OpenTelemetry (OTLP) 协议写入 traces,而 Jaeger V2 原生支持 OTLP,允许 Dapr 直接向 Jaeger V2 实例发送 traces。这种方法推荐用于生产环境,以利用 Jaeger V2 的分布式追踪能力。
在自托管模式下配置 Jaeger V2
本地设置
启动 Jaeger 最简单的方式是运行发布到 DockerHub 的预构建 all-in-one Jaeger 镜像并暴露 OTLP 端口:
注意: 端口 9411 通常由 Zipkin 使用。如果你正在运行 Zipkin(运行
dapr init时默认启动),请先停止dapr_zipkin容器以避免端口冲突:docker stop dapr_zipkin
docker run -d --rm --name jaeger \
  -p 16686:16686 \
  -p 4317:4317 \
  -p 4318:4318 \
  -p 5778:5778 \
  -p 9411:9411 \
  cr.jaegertracing.io/jaegertracing/jaeger:2.11.0
你也可以使用以下命令查看 jaeger 容器的日志:
docker logs jaeger
配置 Dapr 追踪
你有两个选项来配置 Dapr 向 Jaeger V2 发送 traces:
选项 1:使用自定义配置文件
创建一个包含以下内容的 config.yaml 文件:
注意: 由于你使用 OpenTelemetry 协议与 Jaeger 通信,你需要填写追踪配置的
otel部分,并将endpointAddress设置为 Jaeger 容器的地址。
apiVersion: dapr.io/v1alpha1
kind: Configuration
metadata:
  name: tracing
  namespace: default
spec:
  tracing:
    samplingRate: "1"
    stdout: true
    otel:
      endpointAddress: "localhost:4317"
      isSecure: false
      protocol: grpc
要启动引用新 YAML 配置文件的应用程序,请使用 --config 选项。例如:
dapr run --app-id myapp --app-port 3000 node app.js --config config.yaml
选项 2:更新默认 Dapr 配置(开发环境)
或者,在你的开发环境中,导航到你的本地 Dapr 组件目录并使用上述 OTLP 配置更新默认的 config.yaml 文件。这样,所有 Dapr 应用程序将默认使用 Jaeger V2 追踪配置,无需每次指定 --config 标志。
查看 traces
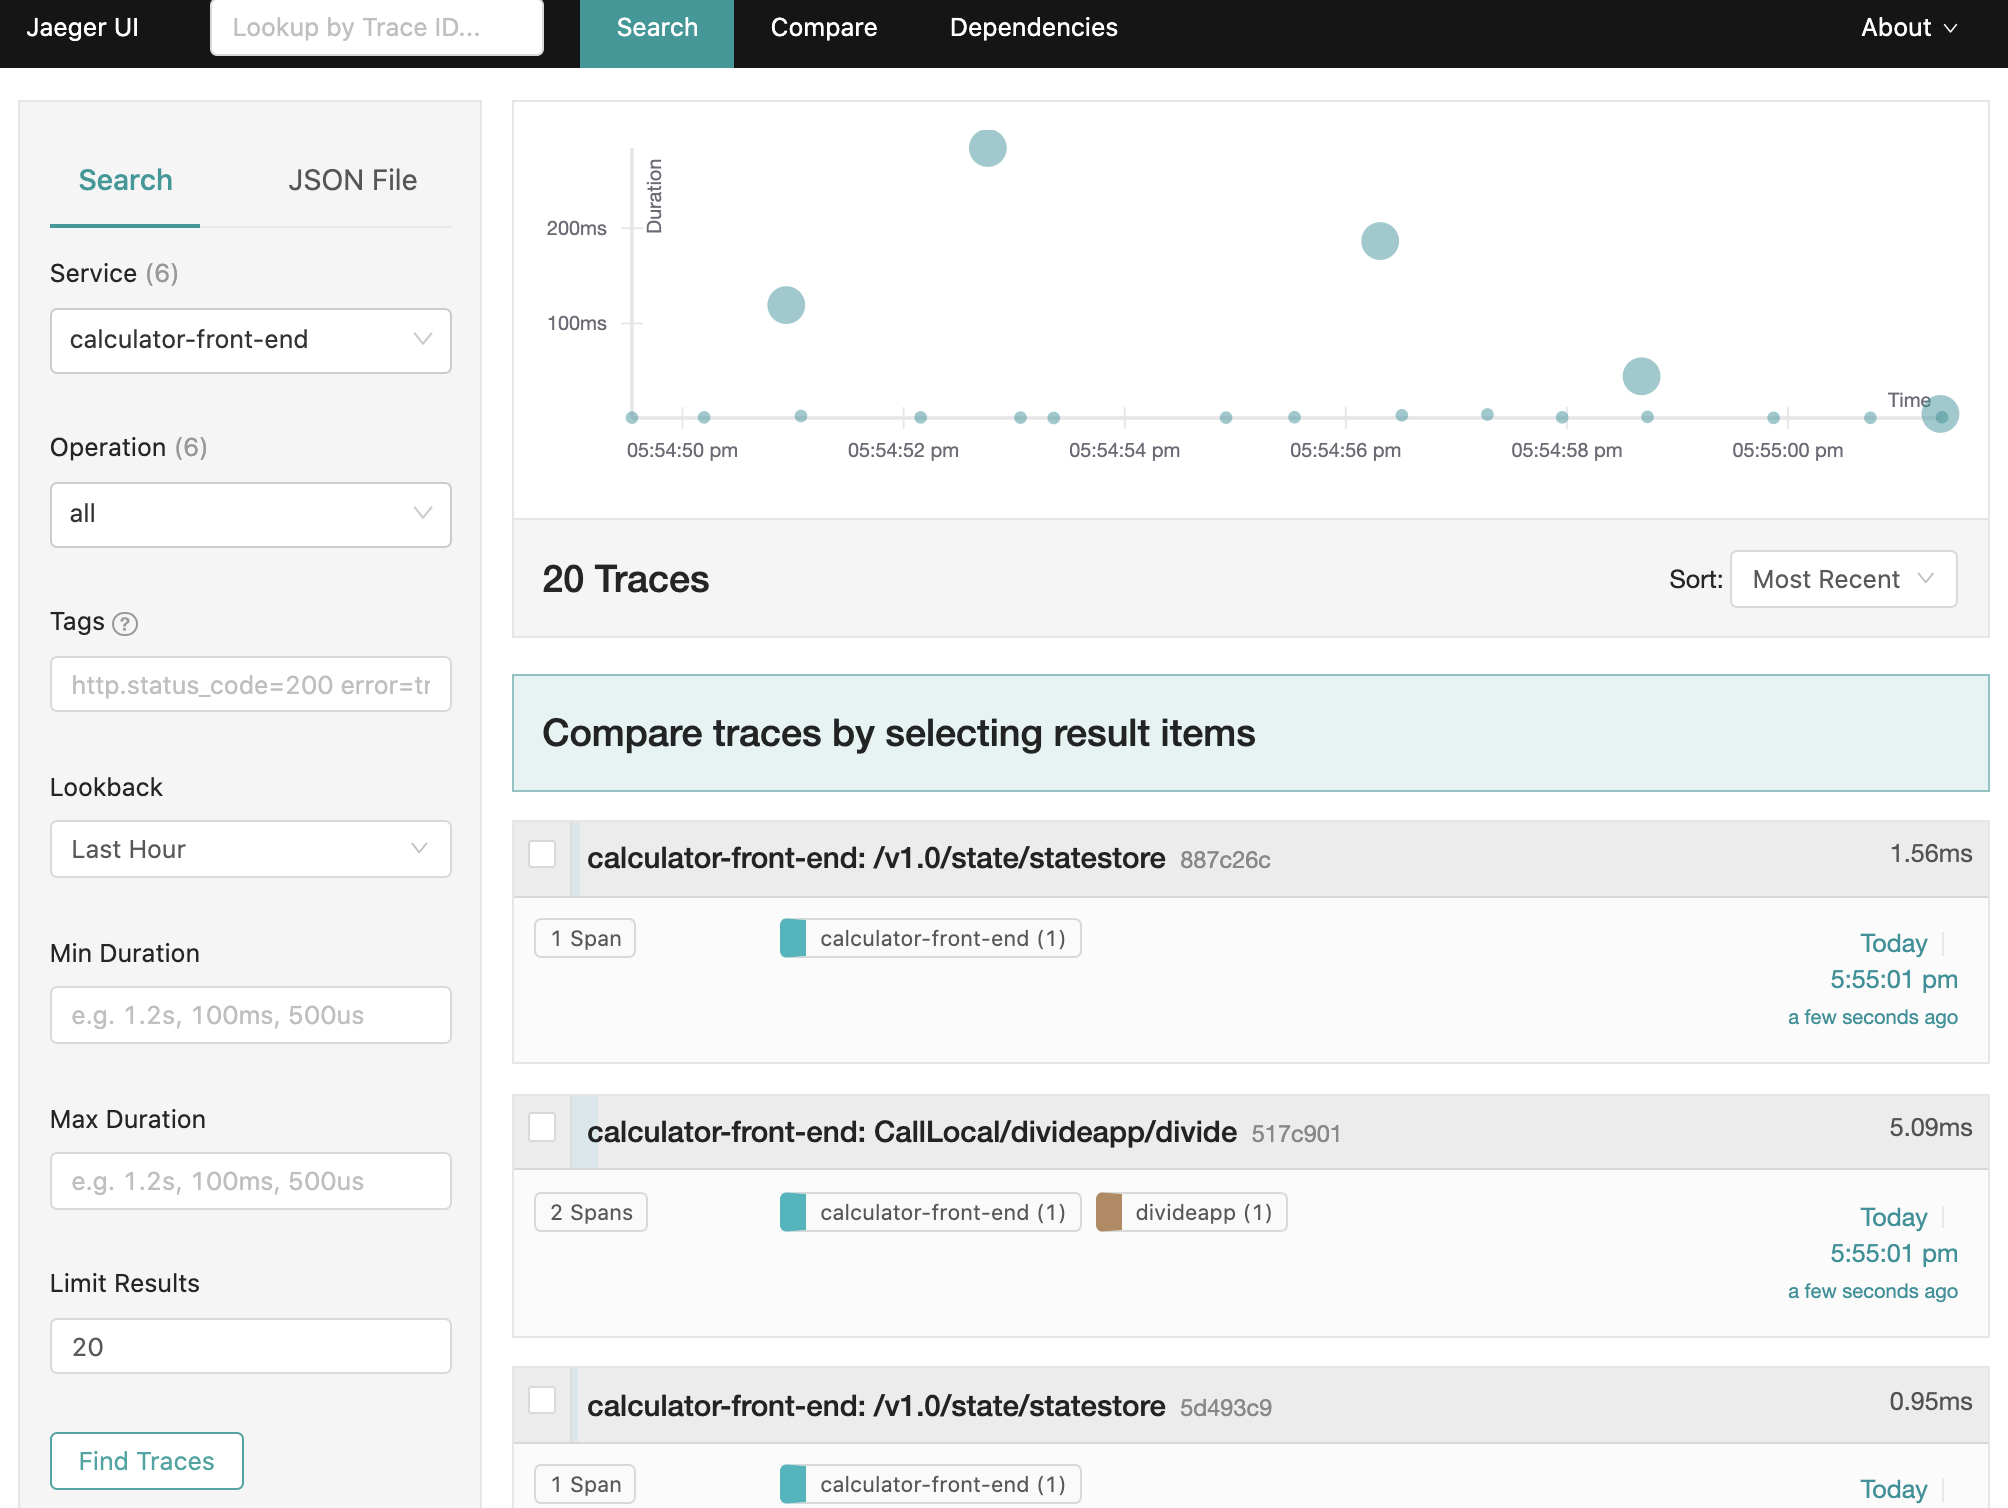
要在浏览器中查看 traces,请访问 http://localhost:16686 以查看 Jaeger UI。
在 Kubernetes 上配置 Jaeger V2
以下步骤展示了如何配置 Dapr 将分布式追踪数据直接发送到使用 OpenTelemetry Operator 部署的 Jaeger V2 实例,该实例使用内存存储。
前提条件
使用 OpenTelemetry Operator 设置 Jaeger V2
Jaeger V2 可以使用 OpenTelemetry Operator 部署,以简化管理并获得原生 OTLP 支持。以下示例配置了使用内存存储的 Jaeger V2。
存储后端说明: 此示例使用内存存储(
memstore)以简化操作,适用于开发或测试环境,因为它在内存中最多存储 100,000 条 traces。对于生产环境,请考虑配置持久化存储后端(如 Cassandra 或 Elasticsearch)以确保 trace 数据的持久性。
安装
注意: 为了使 API 服务器与 Operator 的 webhook 组件通信,webhook 需要 API 服务器配置为信任的 TLS 证书。你可以使用几种不同的方式来生成/配置所需的 TLS 证书,详细信息见 otel operator chart 文档
为简化操作,你可以使用 Helm 创建自动生成的自签名证书。
安装 OpenTelemetry Operator:
helm install opentelemetry-operator open-telemetry/opentelemetry-operator -n opentelemetry-operator-system --create-namespace \
 --set "manager.collectorImage.repository=ghcr.io/open-telemetry/opentelemetry-collector-releases/opentelemetry-collector-k8s" \
 --set admissionWebhooks.certManager.enabled=false \
 --set admissionWebhooks.autoGenerateCert.enabled=true
确认
opentelemetry-operator-system命名空间中的所有资源已就绪。部署使用内存存储的 Jaeger V2 实例: 创建一个名为
jaeger-inmemory.yaml的文件,包含以下配置:apiVersion: opentelemetry.io/v1beta1 kind: OpenTelemetryCollector metadata: name: jaeger-inmemory-instance namespace: observability spec: image: jaegertracing/jaeger:latest ports: - name: jaeger port: 16686 config: service: extensions: [jaeger_storage, jaeger_query] pipelines: traces: receivers: [otlp] exporters: [jaeger_storage_exporter] extensions: jaeger_query: storage: traces: memstore jaeger_storage: backends: memstore: memory: max_traces: 100000 receivers: otlp: protocols: grpc: endpoint: 0.0.0.0:4317 http: endpoint: 0.0.0.0:4318 exporters: jaeger_storage_exporter: trace_storage: memstore使用以下命令应用它:
kubectl apply -f jaeger-inmemory.yaml -n observability
设置 Dapr 向 Jaeger V2 发送 traces
创建一个 Dapr 配置文件以启用追踪,并将边车 traces 直接导出到 Jaeger V2 实例。
创建一个配置文件(例如
tracing.yaml),包含以下内容,更新namespace和otel.endpointAddress以匹配你的 Jaeger V2 实例:apiVersion: dapr.io/v1alpha1 kind: Configuration metadata: name: tracing namespace: order-system spec: tracing: samplingRate: "1" otel: endpointAddress: "jaeger-inmemory-instance-collector.observability.svc.cluster.local:4317" isSecure: false protocol: grpc应用配置:
kubectl apply -f tracing.yaml -n order-system
启用追踪部署应用
通过在要启用分布式追踪的应用程序部署中添加 dapr.io/config 注解来应用 tracing Dapr 配置,如以下示例所示:
apiVersion: apps/v1
kind: Deployment
metadata:
  ...
spec:
  ...
  template:
    metadata:
      ...
      annotations:
        dapr.io/enabled: "true"
        dapr.io/app-id: "MyApp"
        dapr.io/app-port: "8080"
        dapr.io/config: "tracing"
你可以同时注册多个追踪导出器,追踪日志将转发到所有已注册的导出器。
就是这样!无需包含 OpenTelemetry SDK 或检测应用程序代码。Dapr 会自动为你处理分布式追踪。
查看 traces
要查看 Dapr 边车 traces,请转发 Jaeger V2 服务的端口并打开 UI:
kubectl port-forward svc/jaeger-inmemory-instance-collector 16686:16686 -n observability
在浏览器中,访问 http://localhost:16686 以查看 Jaeger V2 UI。