使用 OpenTelemetry Collector 收集追踪数据并发送到 Application Insights
Dapr 使用 OpenTelemetry 协议 (OTLP) 与 OpenTelemetry (OTEL) Collector 集成。本指南通过一个示例演示如何使用 Dapr 通过 OpenTelemetry Collector 将追踪数据推送到 Azure Application Insights。
前置条件
- 在 Kubernetes 上安装 Dapr
- 创建 Application Insights 资源 并记下你的 Application Insights 连接字符串。
设置 OTEL Collector 将数据推送到你的 Application Insights 实例
要将追踪数据推送到你的 Application Insights 实例,请在 Kubernetes 集群上安装 OpenTelemetry Collector。
将
<CONNECTION_STRING>占位符替换为你的 Application Insights 连接字符串。将 OpenTelemetry Collector 部署到运行 Dapr 应用的同一命名空间:
kubectl apply -f open-telemetry-collector-appinsights.yaml
设置 Dapr 将追踪数据发送到 OpenTelemetry Collector
创建 Dapr 配置文件以启用追踪,并通过 OTLP 将追踪数据发送到 OpenTelemetry Collector。
下载并查看
collector-config-otel.yaml。更新namespace和otel.endpointAddress值,使其与部署 Dapr 应用和 OpenTelemetry Collector 的命名空间一致。使用以下命令应用配置:
kubectl apply -f collector-config-otel.yaml
部署启用追踪的应用
通过向要包含在分布式追踪中的 Dapr 应用添加 dapr.io/config 注解来应用 tracing 配置,如下例所示:
apiVersion: apps/v1
kind: Deployment
metadata:
  ...
spec:
  ...
  template:
    metadata:
      ...
      annotations:
        dapr.io/enabled: "true"
        dapr.io/app-id: "MyApp"
        dapr.io/app-port: "8080"
        dapr.io/config: "tracing"
你可以同时注册多个追踪导出器,追踪日志将转发到所有已注册的导出器。
就是这样!无需包含任何 SDK 或对应用程序代码进行插桩。Dapr 会自动为你处理分布式追踪。
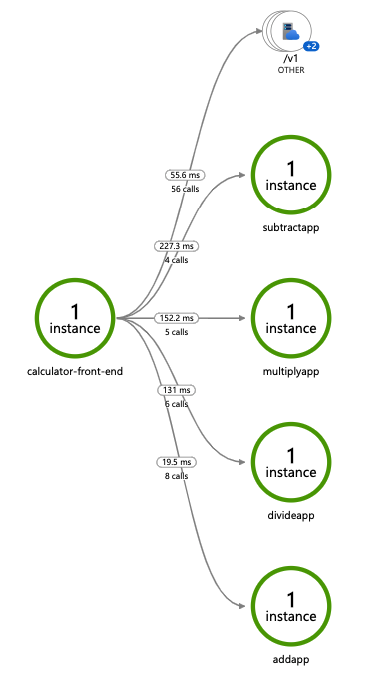
查看追踪数据
部署并运行一些应用程序。几分钟后,你应该会看到追踪日志出现在你的 Application Insights 资源中。你还可以使用 Application Map 来检查服务的拓扑,如下所示: