Using OpenTelemetry to send traces to Jaeger V2
Dapr supports writing traces using the OpenTelemetry (OTLP) protocol, and Jaeger V2 natively supports OTLP, allowing Dapr to send traces directly to a Jaeger V2 instance. This approach is recommended for production to leverage Jaeger V2’s capabilities for distributed tracing.
Configure Jaeger V2 in self-hosted mode
Local setup
The simplest way to start Jaeger is to run the pre-built, all-in-one Jaeger image published to DockerHub and expose the OTLP port:
Note: Port 9411 is commonly used by Zipkin. If you have Zipkin running (starts by default when you run
dapr init), stop thedapr_zipkincontainer first to avoid port conflicts:docker stop dapr_zipkin
docker run -d --rm --name jaeger \
  -p 16686:16686 \
  -p 4317:4317 \
  -p 4318:4318 \
  -p 5778:5778 \
  -p 9411:9411 \
  cr.jaegertracing.io/jaegertracing/jaeger:2.11.0
You can also view the logs from the jaeger container using:
docker logs jaeger
Configure Dapr for tracing
You have two options to configure Dapr to send traces to Jaeger V2:
Option 1: Use a custom config file
Create a config.yaml file with the following content:
Note: Because you are using the Open Telemetry protocol to talk to Jaeger, you need to fill out the
otelsection of the tracing configuration and set theendpointAddressto the address of the Jaeger container.
apiVersion: dapr.io/v1alpha1
kind: Configuration
metadata:
  name: tracing
  namespace: default
spec:
  tracing:
    samplingRate: "1"
    stdout: true
    otel:
      endpointAddress: "localhost:4317"
      isSecure: false
      protocol: grpc
To launch the application referring to the new YAML configuration file, use
the --config option. For example:
dapr run --app-id myapp --app-port 3000 node app.js --config config.yaml
Option 2: Update the default Dapr config (development environment)
Alternatively, in your development environment, navigate to your local Dapr components directory and update the default config.yaml file with the OTLP configuration above. This way, all Dapr applications will use the Jaeger V2 tracing configuration by default without needing to specify the --config flag each time.
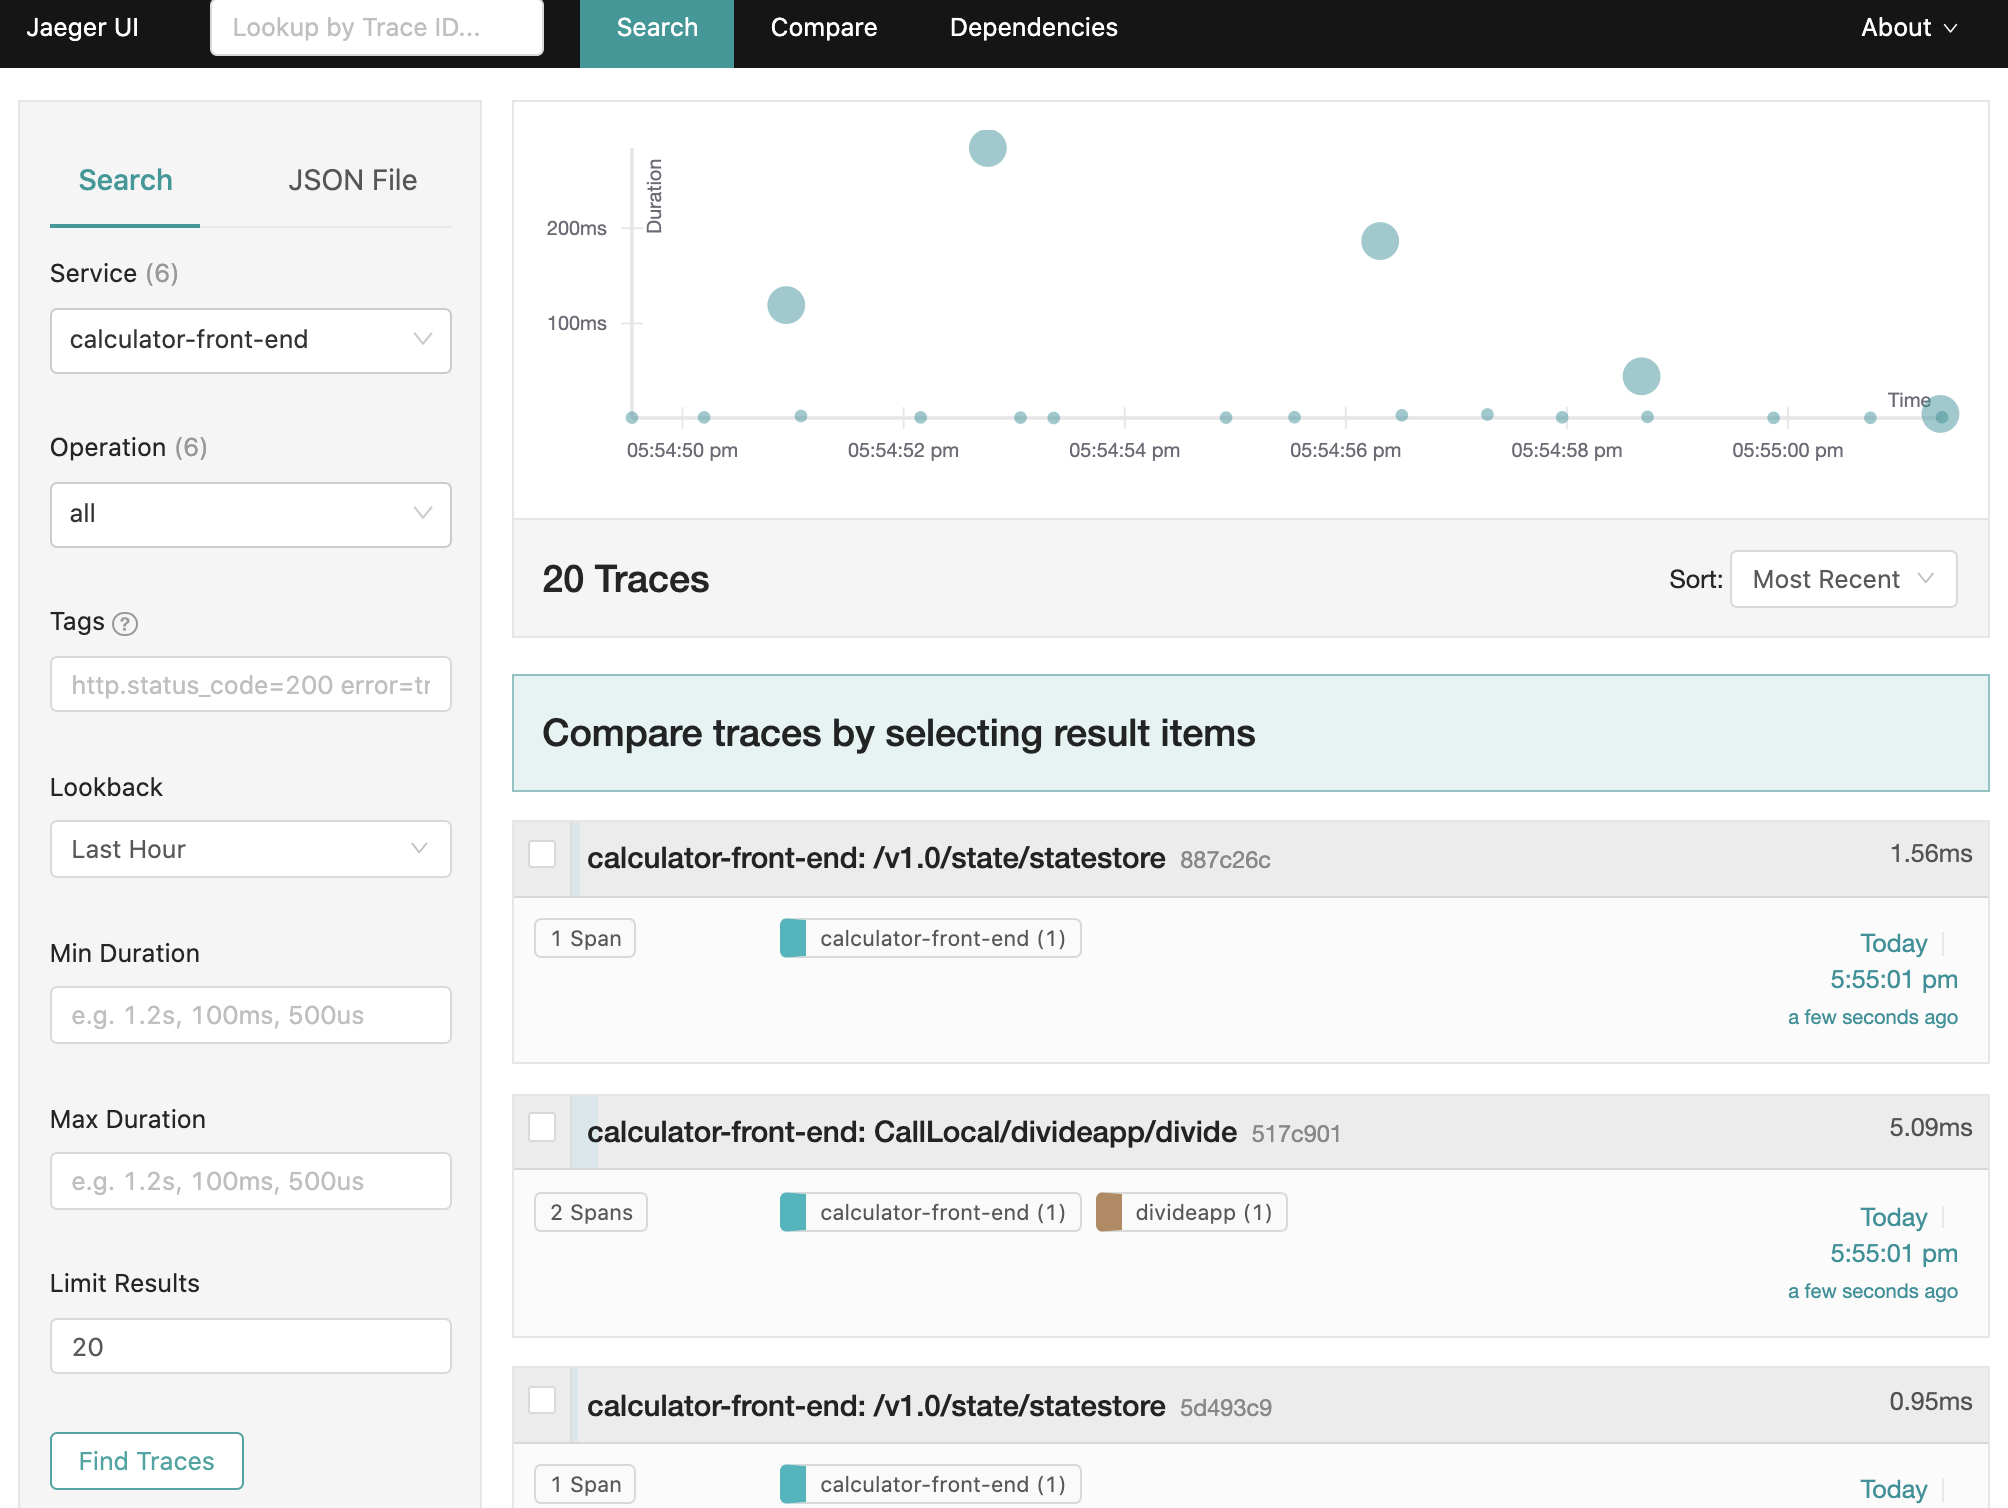
View traces
To view traces in your browser, go to http://localhost:16686 to see the Jaeger UI.
Configure Jaeger V2 on Kubernetes
The following steps show you how to configure Dapr to send distributed tracing data directly to a Jaeger V2 instance deployed using the OpenTelemetry Operator with in-memory storage.
Prerequisites
Set up Jaeger V2 with the OpenTelemetry Operator
Jaeger V2 can be deployed using the OpenTelemetry Operator for simplified management and native OTLP support. The following example configures Jaeger V2 with in-memory storage.
Note on Storage Backends: This example uses in-memory storage (
memstore) for simplicity, suitable for development or testing environments as it stores up to 100,000 traces in memory. For production environments, consider configuring a persistent storage backend like Cassandra or Elasticsearch to ensure trace data durability.
Installation
Note: In order for the API server to communicate with the webhook component of the operator, the webhook requires a TLS certificate that the API server is configured to trust. There are a few different ways you can use to generate/configure the required TLS certificate detailed in the otel operator chart docs
For simplicity you can use Helm to create an automatically generated self-signed certificate.
Install the OpenTelemetry Operator:
helm install opentelemetry-operator open-telemetry/opentelemetry-operator -n opentelemetry-operator-system --create-namespace \
 --set "manager.collectorImage.repository=ghcr.io/open-telemetry/opentelemetry-collector-releases/opentelemetry-collector-k8s" \
 --set admissionWebhooks.certManager.enabled=false \
 --set admissionWebhooks.autoGenerateCert.enabled=true
Confirm that all resources in the
opentelemetry-operator-systemnamespace are ready.Deploy a Jaeger V2 instance with in-memory storage: Create a file named
jaeger-inmemory.yamlwith the following configuration:apiVersion: opentelemetry.io/v1beta1 kind: OpenTelemetryCollector metadata: name: jaeger-inmemory-instance namespace: observability spec: image: jaegertracing/jaeger:latest ports: - name: jaeger port: 16686 config: service: extensions: [jaeger_storage, jaeger_query] pipelines: traces: receivers: [otlp] exporters: [jaeger_storage_exporter] extensions: jaeger_query: storage: traces: memstore jaeger_storage: backends: memstore: memory: max_traces: 100000 receivers: otlp: protocols: grpc: endpoint: 0.0.0.0:4317 http: endpoint: 0.0.0.0:4318 exporters: jaeger_storage_exporter: trace_storage: memstoreApply it with:
kubectl apply -f jaeger-inmemory.yaml -n observability
Set up Dapr to send traces to Jaeger V2
Create a Dapr configuration file to enable tracing and export the sidecar traces directly to the Jaeger V2 instance.
Create a configuration file (for example
tracing.yaml) with the following content, updating thenamespaceandotel.endpointAddressto match your Jaeger V2 instance:apiVersion: dapr.io/v1alpha1 kind: Configuration metadata: name: tracing namespace: order-system spec: tracing: samplingRate: "1" otel: endpointAddress: "jaeger-inmemory-instance-collector.observability.svc.cluster.local:4317" isSecure: false protocol: grpcApply the configuration:
kubectl apply -f tracing.yaml -n order-system
Deploy your app with tracing enabled
Apply the tracing Dapr configuration by adding a dapr.io/config annotation to the application deployment that you want to enable distributed tracing for, as shown in the following example:
apiVersion: apps/v1
kind: Deployment
metadata:
  ...
spec:
  ...
  template:
    metadata:
      ...
      annotations:
        dapr.io/enabled: "true"
        dapr.io/app-id: "MyApp"
        dapr.io/app-port: "8080"
        dapr.io/config: "tracing"
You can register multiple tracing exporters at the same time, and the tracing logs are forwarded to all registered exporters.
That’s it! There’s no need to include the OpenTelemetry SDK or instrument your application code. Dapr automatically handles the distributed tracing for you.
View traces
To view Dapr sidecar traces, port-forward the Jaeger V2 service and open the UI:
kubectl port-forward svc/jaeger-inmemory-instance-collector 16686:16686 -n observability
In your browser, go to http://localhost:16686 to see the Jaeger V2 UI.