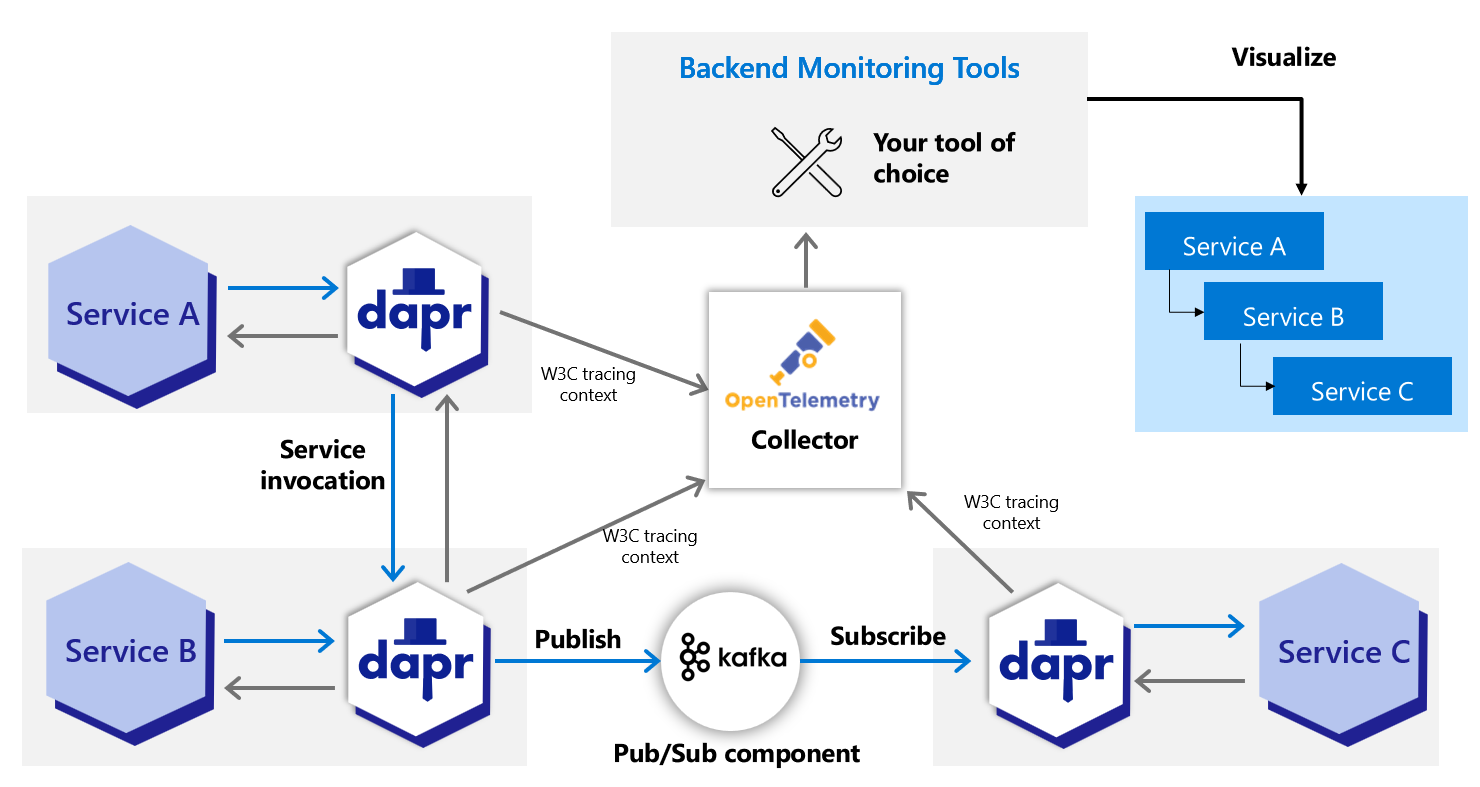
Using OpenTelemetry Collector to collect traces
Dapr directly writes traces using the OpenTelemetry (OTLP) protocol as the recommended method. For observability tools that support the OTLP directly, it is recommended to use the OpenTelemetry Collector, as it allows your application to quickly offload data and includes features, such as retries, batching, and encryption. For more information, read the Open Telemetry Collector documentation.
Dapr can also write traces using the Zipkin protocol. Prior to supporting the OTLP protocol, the Zipkin protocol was used with the OpenTelemetry Collector to send traces to observability tools such as AWS X-Ray, Google Cloud Operations Suite, and Azure Monitor. Both protocol approaches are valid, however the OpenTelemetry protocol is the recommended choice.
Prerequisites
- Install Dapr on Kubernetes
- Verify your trace backends are already set up to receive traces
- Review your OTEL Collector exporter’s required parameters:
Set up OTEL Collector to push to your trace backend
Check out the
open-telemetry-collector-generic.yaml.Replace the
<your-exporter-here>section with the correct settings for your trace exporter.- Refer to the OTEL Collector links in the prerequisites section to determine the correct settings.
Apply the configuration with:
kubectl apply -f open-telemetry-collector-generic.yaml
Set up Dapr to send traces to OTEL Collector
Set up a Dapr configuration file to turn on tracing and deploy a tracing exporter component that uses the OpenTelemetry Collector.
Use this
collector-config.yamlfile to create your own configuration.Apply the configuration with:
kubectl apply -f collector-config.yaml
Deploy your app with tracing
Apply the appconfig configuration by adding a dapr.io/config annotation to the container that you want to participate in the distributed tracing, as shown in the following example:
apiVersion: apps/v1
kind: Deployment
metadata:
  ...
spec:
  ...
  template:
    metadata:
      ...
      annotations:
        dapr.io/enabled: "true"
        dapr.io/app-id: "MyApp"
        dapr.io/app-port: "8080"
        dapr.io/config: "appconfig"
Note
If you are using one of the Dapr tutorials, such as distributed calculator, theappconfig configuration is already configured, so no additional settings are needed.You can register multiple tracing exporters at the same time, and the tracing logs are forwarded to all registered exporters.
That’s it! There’s no need to include any SDKs or instrument your application code. Dapr automatically handles the distributed tracing for you.
View traces
Deploy and run some applications. Wait for the trace to propagate to your tracing backend and view them there.
Related links
- Try out the observability quickstart
- Learn how to set tracing configuration options