This is the multi-page printable view of this section. Click here to print.
Open Telemetry Collector
1 - Using OpenTelemetry Collector to collect traces
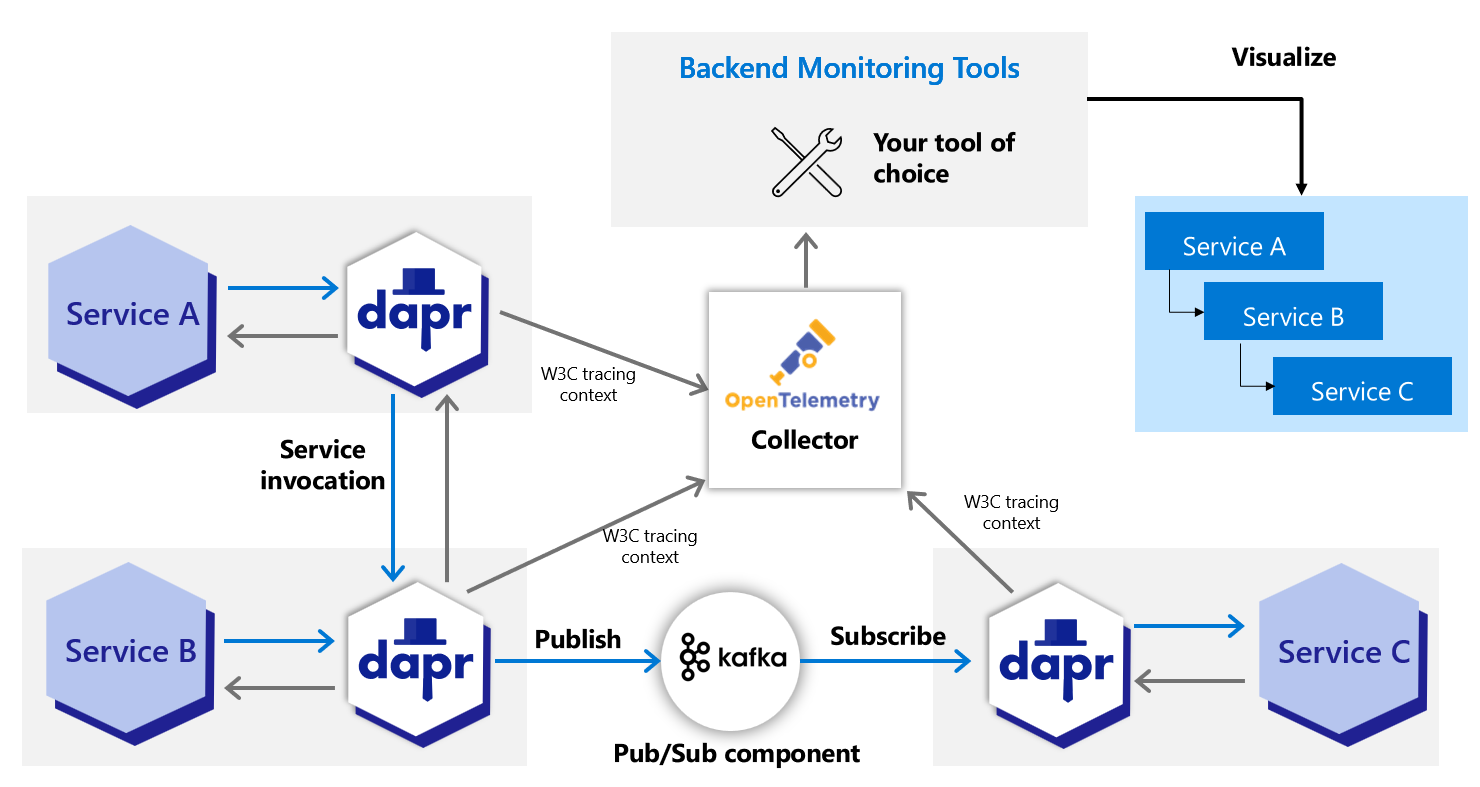
Dapr directly writes traces using the OpenTelemetry (OTLP) protocol as the recommended method. For observability tools that support the OTLP directly, it is recommended to use the OpenTelemetry Collector, as it allows your application to quickly offload data and includes features, such as retries, batching, and encryption. For more information, read the Open Telemetry Collector documentation.
Dapr can also write traces using the Zipkin protocol. Prior to supporting the OTLP protocol, the Zipkin protocol was used with the OpenTelemetry Collector to send traces to observability tools such as AWS X-Ray, Google Cloud Operations Suite, and Azure Monitor. Both protocol approaches are valid, however the OpenTelemetry protocol is the recommended choice.
Prerequisites
- Install Dapr on Kubernetes
- Verify your trace backends are already set up to receive traces
- Review your OTEL Collector exporter’s required parameters:
Set up OTEL Collector to push to your trace backend
Check out the
open-telemetry-collector-generic.yaml.Replace the
<your-exporter-here>section with the correct settings for your trace exporter.- Refer to the OTEL Collector links in the prerequisites section to determine the correct settings.
Apply the configuration with:
kubectl apply -f open-telemetry-collector-generic.yaml
Set up Dapr to send traces to OTEL Collector
Set up a Dapr configuration file to turn on tracing and deploy a tracing exporter component that uses the OpenTelemetry Collector.
Use this
collector-config.yamlfile to create your own configuration.Apply the configuration with:
kubectl apply -f collector-config.yaml
Deploy your app with tracing
Apply the appconfig configuration by adding a dapr.io/config annotation to the container that you want to participate in the distributed tracing, as shown in the following example:
apiVersion: apps/v1
kind: Deployment
metadata:
  ...
spec:
  ...
  template:
    metadata:
      ...
      annotations:
        dapr.io/enabled: "true"
        dapr.io/app-id: "MyApp"
        dapr.io/app-port: "8080"
        dapr.io/config: "appconfig"
Note
If you are using one of the Dapr tutorials, such as distributed calculator, theappconfig configuration is already configured, so no additional settings are needed.You can register multiple tracing exporters at the same time, and the tracing logs are forwarded to all registered exporters.
That’s it! There’s no need to include any SDKs or instrument your application code. Dapr automatically handles the distributed tracing for you.
View traces
Deploy and run some applications. Wait for the trace to propagate to your tracing backend and view them there.
Related links
- Try out the observability quickstart
- Learn how to set tracing configuration options
2 - Using Dynatrace OpenTelemetry Collector to collect traces to send to Dynatrace
Dapr integrates with the Dynatrace Collector using the OpenTelemetry protocol (OTLP). This guide walks through an example using Dapr to push traces to Dynatrace, using the Dynatrace version of the OpenTelemetry Collector.
Note
This guide refers to the Dynatrace OpenTelemetry Collector, which uses the same Helm chart as the open-source collector but overridden with the Dynatrace-maintained image for better support and Dynatrace-specific features.Prerequisites
- Install Dapr on Kubernetes
- Access to a Dynatrace tenant and an API token with
openTelemetryTrace.ingest,metrics.ingest, andlogs.ingestscopes - Helm
Set up Dynatrace OpenTelemetry Collector to push to your Dynatrace instance
To push traces to your Dynatrace instance, install the Dynatrace OpenTelemetry Collector on your Kubernetes cluster.
Create a Kubernetes secret with your Dynatrace credentials:
kubectl create secret generic dynatrace-otelcol-dt-api-credentials \
  --from-literal=DT_ENDPOINT=https://YOUR_TENANT.live.dynatrace.com/api/v2/otlp \
  --from-literal=DT_API_TOKEN=dt0s01.YOUR_TOKEN_HERE
Replace
YOUR_TENANTwith your Dynatrace tenant ID andYOUR_TOKEN_HEREwith your Dynatrace API token.Use the Dynatrace OpenTelemetry Collector distribution for better defaults and support than the open source version. Download and inspect the
collector-helm-values.yamlfile. This is based on the k8s enrichment demo and includes Kubernetes metadata enrichment for proper pod/namespace/cluster context.Deploy the Dynatrace Collector with Helm.
helm repo add open-telemetry https://open-telemetry.github.io/opentelemetry-helm-charts
helm repo update
helm upgrade -i dynatrace-collector open-telemetry/opentelemetry-collector -f collector-helm-values.yaml
Set up Dapr to send traces to the Dynatrace Collector
Create a Dapr configuration file to enable tracing and send traces to the OpenTelemetry Collector via OTLP.
Update the following file to ensure the
endpointAddresspoints to your Dynatrace OpenTelemetry Collector service in your Kubernetes cluster. If deployed in thedefaultnamespace, it’s typicallydynatrace-collector.default.svc.cluster.local.Important: Ensure the
endpointAddressdoes NOT include thehttp://prefix to avoid URL encoding issues:apiVersion: dapr.io/v1alpha1 kind: Configuration metadata: name: tracing spec: tracing: samplingRate: "1" otel: endpointAddress: "dynatrace-collector.default.svc.cluster.local:4318" # Update with your collector's service addressApply the configuration with:
kubectl apply -f collector-config-otel.yaml
Deploy your app with tracing
Apply the tracing configuration by adding a dapr.io/config annotation to the Dapr applications that you want to include in distributed tracing, as shown in the following example:
apiVersion: apps/v1
kind: Deployment
metadata:
  ...
spec:
  ...
  template:
    metadata:
      ...
      annotations:
        dapr.io/enabled: "true"
        dapr.io/app-id: "MyApp"
        dapr.io/app-port: "8080"
        dapr.io/config: "tracing"
Note
If you are using one of the Dapr tutorials, such as distributed calculator, you will need to update theappconfig configuration to tracing.You can register multiple tracing exporters at the same time, and the tracing logs are forwarded to all registered exporters.
That’s it! There’s no need to include any SDKs or instrument your application code. Dapr automatically handles the distributed tracing for you.
View traces
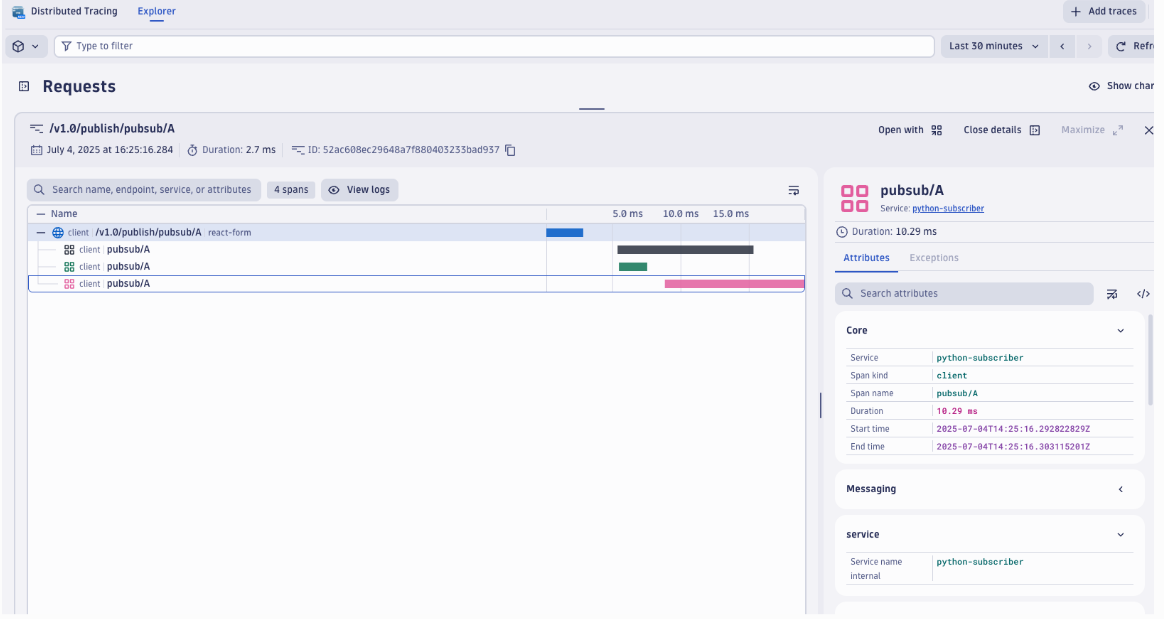
Deploy and run some applications. After a few minutes, you should see traces appearing in your Dynatrace tenant:
- Navigate to Search > Distributed tracing in your Dynatrace UI.
- Filter by service names to see your Dapr applications and their associated tracing spans.
Note
Only operations going through Dapr API exposed by Dapr sidecar (for example, service invocation or event publishing) are displayed in Dynatrace distributed traces.Disable OneAgent daprd monitoring
If you are running Dynatrace OneAgent in your cluster, you should exclude the daprd sidecar container from OneAgent monitoring to prevent interferences in this configuration. Excluding it prevents any automatic injection attempts that could break functionality or result in confusing traces.
Add this annotation to your application deployments or globally in your dynakube configuration file:
metadata:
  annotations:
    dapr.io/enabled: "true"
    dapr.io/app-id: "MyApp"
    dapr.io/app-port: "8080"
    dapr.io/config: "tracing"
    container.inject.dynatrace.com/daprd: "false" # Exclude dapr sidecar from being auto-monitored by OneAgent
Related links
- Try out the observability quickstart
- Learn how to set tracing configuration options
- Dynatrace OpenTelemetry documentation
- Enrich OTLP telemetry data with Kubernetes metadata
3 - Using OpenTelemetry Collector to collect traces to send to App Insights
Dapr integrates with OpenTelemetry (OTEL) Collector using the OpenTelemetry protocol (OTLP). This guide walks through an example using Dapr to push traces to Azure Application Insights, using the OpenTelemetry Collector.
Prerequisites
- Install Dapr on Kubernetes
- Create an Application Insights resource and make note of your Application Insights connection string.
Set up OTEL Collector to push to your App Insights instance
To push traces to your Application Insights instance, install the OpenTelemetry Collector on your Kubernetes cluster.
Download and inspect the
open-telemetry-collector-appinsights.yamlfile.Replace the
<CONNECTION_STRING>placeholder with your App Insights connection string.Deploy the OpenTelemetry Collector into the same namespace where your Dapr-enabled applications are running:
kubectl apply -f open-telemetry-collector-appinsights.yaml
Set up Dapr to send traces to the OpenTelemetry Collector
Create a Dapr configuration file to enable tracing and send traces to the OpenTelemetry Collector via OTLP.
Download and inspect the
collector-config-otel.yaml. Update thenamespaceandotel.endpointAddressvalues to align with the namespace where your Dapr-enabled applications and OpenTelemetry Collector are deployed.Apply the configuration with:
kubectl apply -f collector-config-otel.yaml
Deploy your app with tracing
Apply the tracing configuration by adding a dapr.io/config annotation to the Dapr applications that you want to include in distributed tracing, as shown in the following example:
apiVersion: apps/v1
kind: Deployment
metadata:
  ...
spec:
  ...
  template:
    metadata:
      ...
      annotations:
        dapr.io/enabled: "true"
        dapr.io/app-id: "MyApp"
        dapr.io/app-port: "8080"
        dapr.io/config: "tracing"
Note
If you are using one of the Dapr tutorials, such as distributed calculator, you will need to update theappconfig configuration to tracing.You can register multiple tracing exporters at the same time, and the tracing logs are forwarded to all registered exporters.
That’s it! There’s no need to include any SDKs or instrument your application code. Dapr automatically handles the distributed tracing for you.
View traces
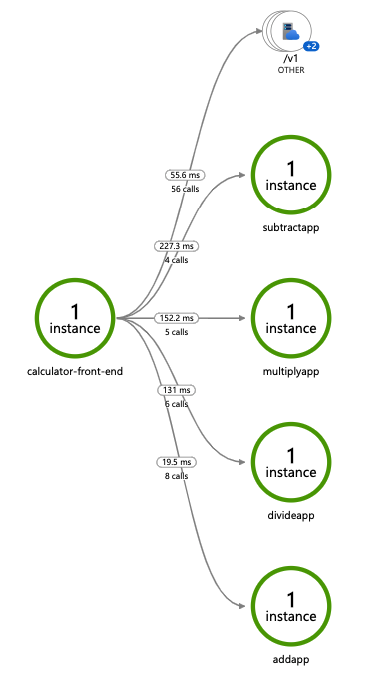
Deploy and run some applications. After a few minutes, you should see tracing logs appearing in your App Insights resource. You can also use the Application Map to examine the topology of your services, as shown below:
Note
Only operations going through Dapr API exposed by Dapr sidecar (for example, service invocation or event publishing) are displayed in Application Map topology.Related links
- Try out the observability quickstart
- Learn how to set tracing configuration options
4 - Using OpenTelemetry to send traces to Jaeger V2
Dapr supports writing traces using the OpenTelemetry (OTLP) protocol, and Jaeger V2 natively supports OTLP, allowing Dapr to send traces directly to a Jaeger V2 instance. This approach is recommended for production to leverage Jaeger V2’s capabilities for distributed tracing.
Configure Jaeger V2 in self-hosted mode
Local setup
The simplest way to start Jaeger is to run the pre-built, all-in-one Jaeger image published to DockerHub and expose the OTLP port:
Note: Port 9411 is commonly used by Zipkin. If you have Zipkin running (starts by default when you run
dapr init), stop thedapr_zipkincontainer first to avoid port conflicts:docker stop dapr_zipkin
docker run -d --rm --name jaeger \
  -p 16686:16686 \
  -p 4317:4317 \
  -p 4318:4318 \
  -p 5778:5778 \
  -p 9411:9411 \
  cr.jaegertracing.io/jaegertracing/jaeger:2.11.0
You can also view the logs from the jaeger container using:
docker logs jaeger
Configure Dapr for tracing
You have two options to configure Dapr to send traces to Jaeger V2:
Option 1: Use a custom config file
Create a config.yaml file with the following content:
Note: Because you are using the Open Telemetry protocol to talk to Jaeger, you need to fill out the
otelsection of the tracing configuration and set theendpointAddressto the address of the Jaeger container.
apiVersion: dapr.io/v1alpha1
kind: Configuration
metadata:
  name: tracing
  namespace: default
spec:
  tracing:
    samplingRate: "1"
    stdout: true
    otel:
      endpointAddress: "localhost:4317"
      isSecure: false
      protocol: grpc
To launch the application referring to the new YAML configuration file, use
the --config option. For example:
dapr run --app-id myapp --app-port 3000 node app.js --config config.yaml
Option 2: Update the default Dapr config (development environment)
Alternatively, in your development environment, navigate to your local Dapr components directory and update the default config.yaml file with the OTLP configuration above. This way, all Dapr applications will use the Jaeger V2 tracing configuration by default without needing to specify the --config flag each time.
View traces
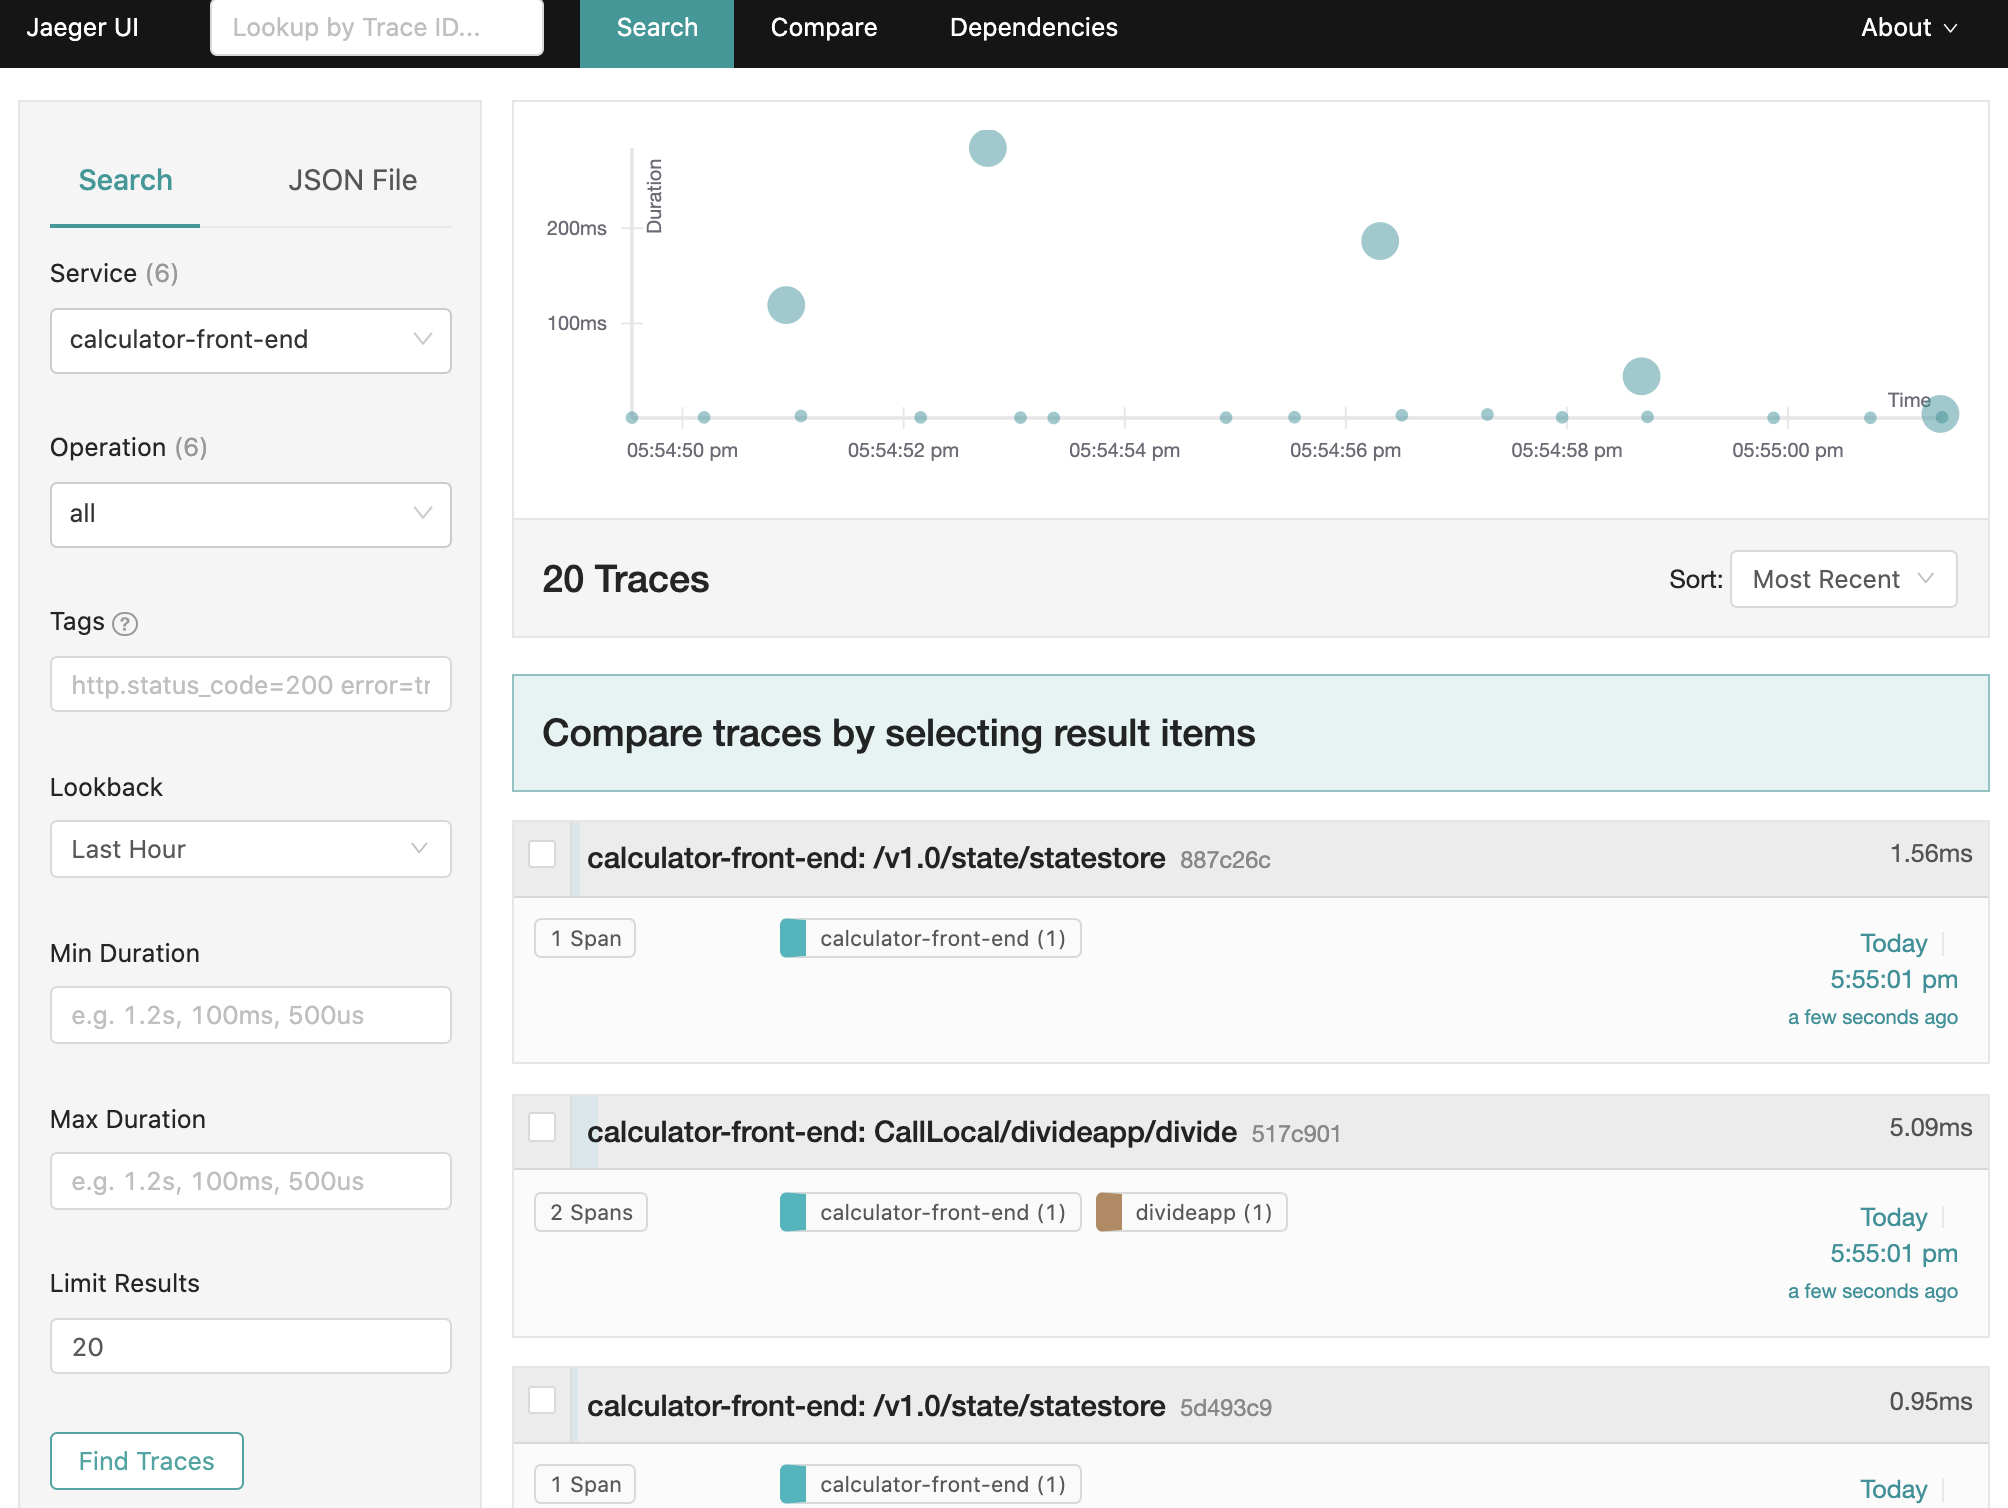
To view traces in your browser, go to http://localhost:16686 to see the Jaeger UI.
Configure Jaeger V2 on Kubernetes
The following steps show you how to configure Dapr to send distributed tracing data directly to a Jaeger V2 instance deployed using the OpenTelemetry Operator with in-memory storage.
Prerequisites
Set up Jaeger V2 with the OpenTelemetry Operator
Jaeger V2 can be deployed using the OpenTelemetry Operator for simplified management and native OTLP support. The following example configures Jaeger V2 with in-memory storage.
Note on Storage Backends: This example uses in-memory storage (
memstore) for simplicity, suitable for development or testing environments as it stores up to 100,000 traces in memory. For production environments, consider configuring a persistent storage backend like Cassandra or Elasticsearch to ensure trace data durability.
Installation
Note: In order for the API server to communicate with the webhook component of the operator, the webhook requires a TLS certificate that the API server is configured to trust. There are a few different ways you can use to generate/configure the required TLS certificate detailed in the otel operator chart docs
For simplicity you can use Helm to create an automatically generated self-signed certificate.
Install the OpenTelemetry Operator:
helm install opentelemetry-operator open-telemetry/opentelemetry-operator -n opentelemetry-operator-system --create-namespace \
 --set "manager.collectorImage.repository=ghcr.io/open-telemetry/opentelemetry-collector-releases/opentelemetry-collector-k8s" \
 --set admissionWebhooks.certManager.enabled=false \
 --set admissionWebhooks.autoGenerateCert.enabled=true
Confirm that all resources in the
opentelemetry-operator-systemnamespace are ready.Deploy a Jaeger V2 instance with in-memory storage: Create a file named
jaeger-inmemory.yamlwith the following configuration:apiVersion: opentelemetry.io/v1beta1 kind: OpenTelemetryCollector metadata: name: jaeger-inmemory-instance namespace: observability spec: image: jaegertracing/jaeger:latest ports: - name: jaeger port: 16686 config: service: extensions: [jaeger_storage, jaeger_query] pipelines: traces: receivers: [otlp] exporters: [jaeger_storage_exporter] extensions: jaeger_query: storage: traces: memstore jaeger_storage: backends: memstore: memory: max_traces: 100000 receivers: otlp: protocols: grpc: endpoint: 0.0.0.0:4317 http: endpoint: 0.0.0.0:4318 exporters: jaeger_storage_exporter: trace_storage: memstoreApply it with:
kubectl apply -f jaeger-inmemory.yaml -n observability
Set up Dapr to send traces to Jaeger V2
Create a Dapr configuration file to enable tracing and export the sidecar traces directly to the Jaeger V2 instance.
Create a configuration file (for example
tracing.yaml) with the following content, updating thenamespaceandotel.endpointAddressto match your Jaeger V2 instance:apiVersion: dapr.io/v1alpha1 kind: Configuration metadata: name: tracing namespace: order-system spec: tracing: samplingRate: "1" otel: endpointAddress: "jaeger-inmemory-instance-collector.observability.svc.cluster.local:4317" isSecure: false protocol: grpcApply the configuration:
kubectl apply -f tracing.yaml -n order-system
Deploy your app with tracing enabled
Apply the tracing Dapr configuration by adding a dapr.io/config annotation to the application deployment that you want to enable distributed tracing for, as shown in the following example:
apiVersion: apps/v1
kind: Deployment
metadata:
  ...
spec:
  ...
  template:
    metadata:
      ...
      annotations:
        dapr.io/enabled: "true"
        dapr.io/app-id: "MyApp"
        dapr.io/app-port: "8080"
        dapr.io/config: "tracing"
You can register multiple tracing exporters at the same time, and the tracing logs are forwarded to all registered exporters.
That’s it! There’s no need to include the OpenTelemetry SDK or instrument your application code. Dapr automatically handles the distributed tracing for you.
View traces
To view Dapr sidecar traces, port-forward the Jaeger V2 service and open the UI:
kubectl port-forward svc/jaeger-inmemory-instance-collector 16686:16686 -n observability
In your browser, go to http://localhost:16686 to see the Jaeger V2 UI.