Diagrid Dapr Dev Dashboard
The Dapr Dev Dashboard is a free and open source companion for local Dapr development. It automatically discovers Dapr applications running on your machine and provides visualization and inspection tools to speed up your development workflow. It is distributed as a single binary for macOS, Linux, and Windows.
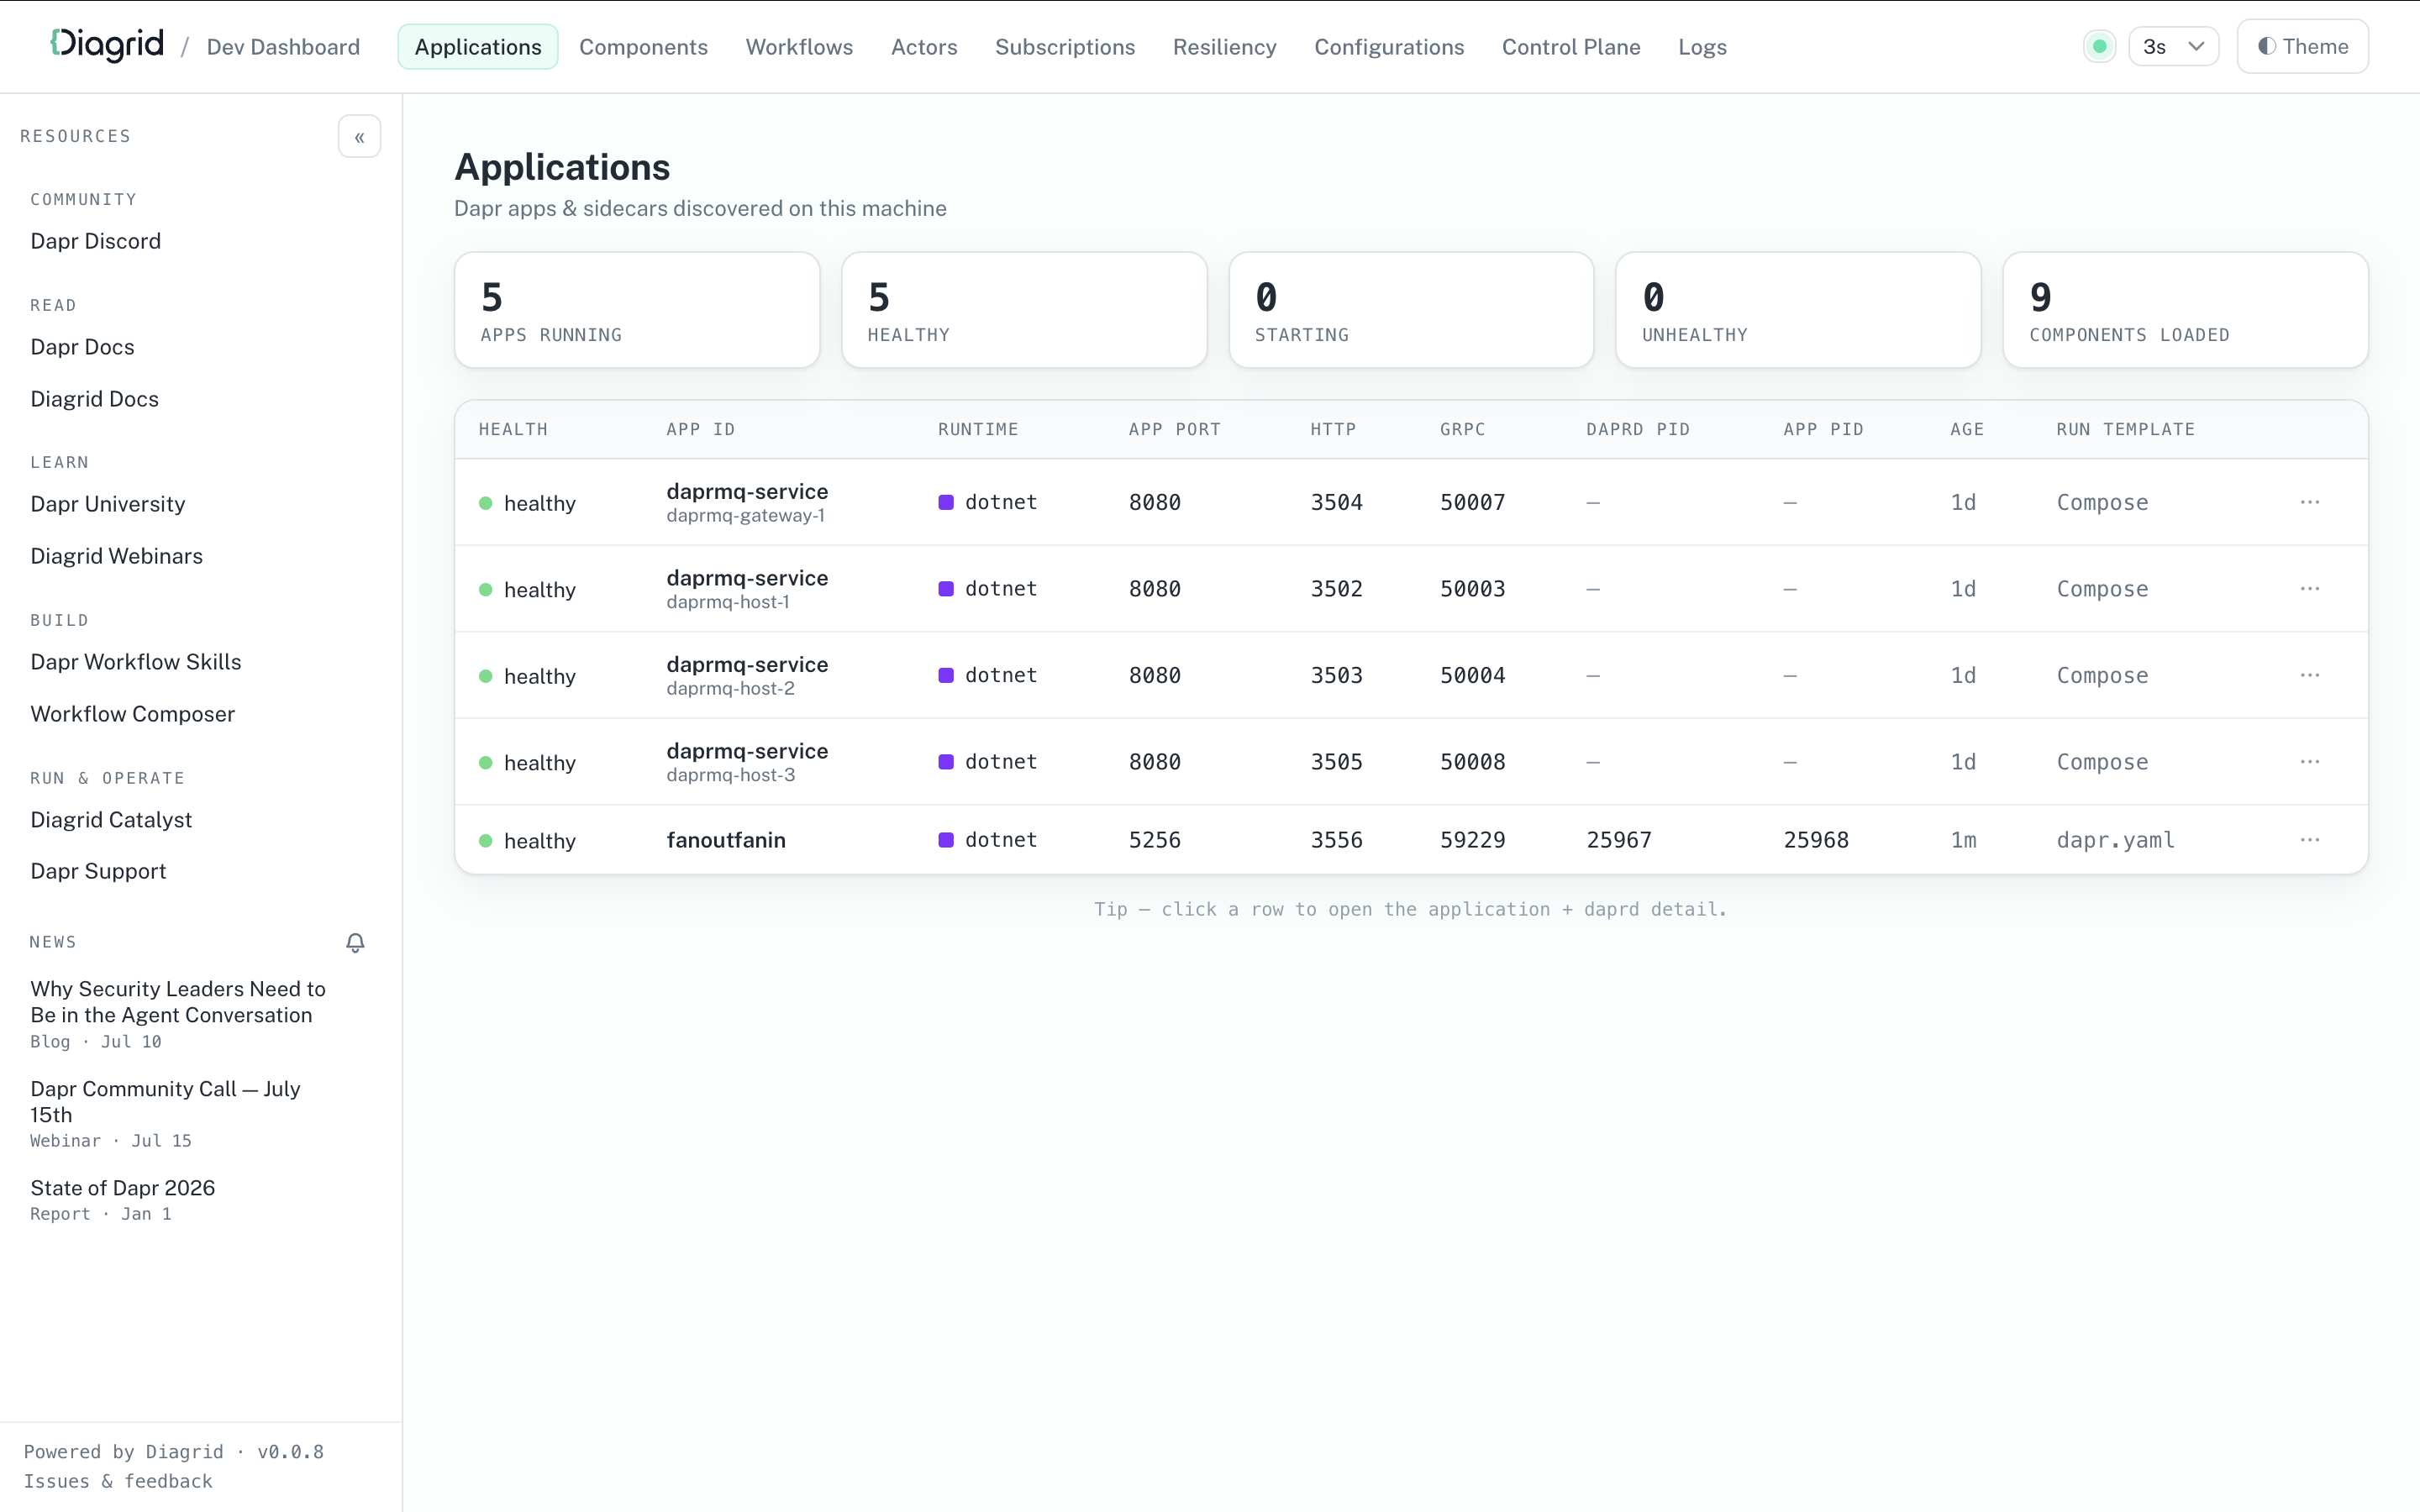
Application monitoring
Track all running Dapr apps with details on health, ports, PIDs, and runtime information.
Workflow inspection
View workflow executions across your apps with live event histories and execution status, and terminate, purge, or re-run instances.
Actors, subscriptions, and state
Review actor types and active actor counts, list pub/sub subscriptions and publish test messages to them, and browse, add, and delete records in your state stores.
Component and configuration viewers
Browse Dapr components and configurations, and use builder wizards to create component and resiliency policy definitions without hand-editing YAML.
Control plane and logs
Check the status of the local Dapr control plane services, and stream real-time sidecar and application logs with filtering and highlighting.
Dapr CLI commands
Copy the Dapr CLI command that matches what you’re looking at, such as the history of a workflow instance.
The Dev Dashboard works with applications started through dapr run, Aspire, Docker Compose, or Dapr Testcontainers.