Diagrid Dapr Ops Dashboard
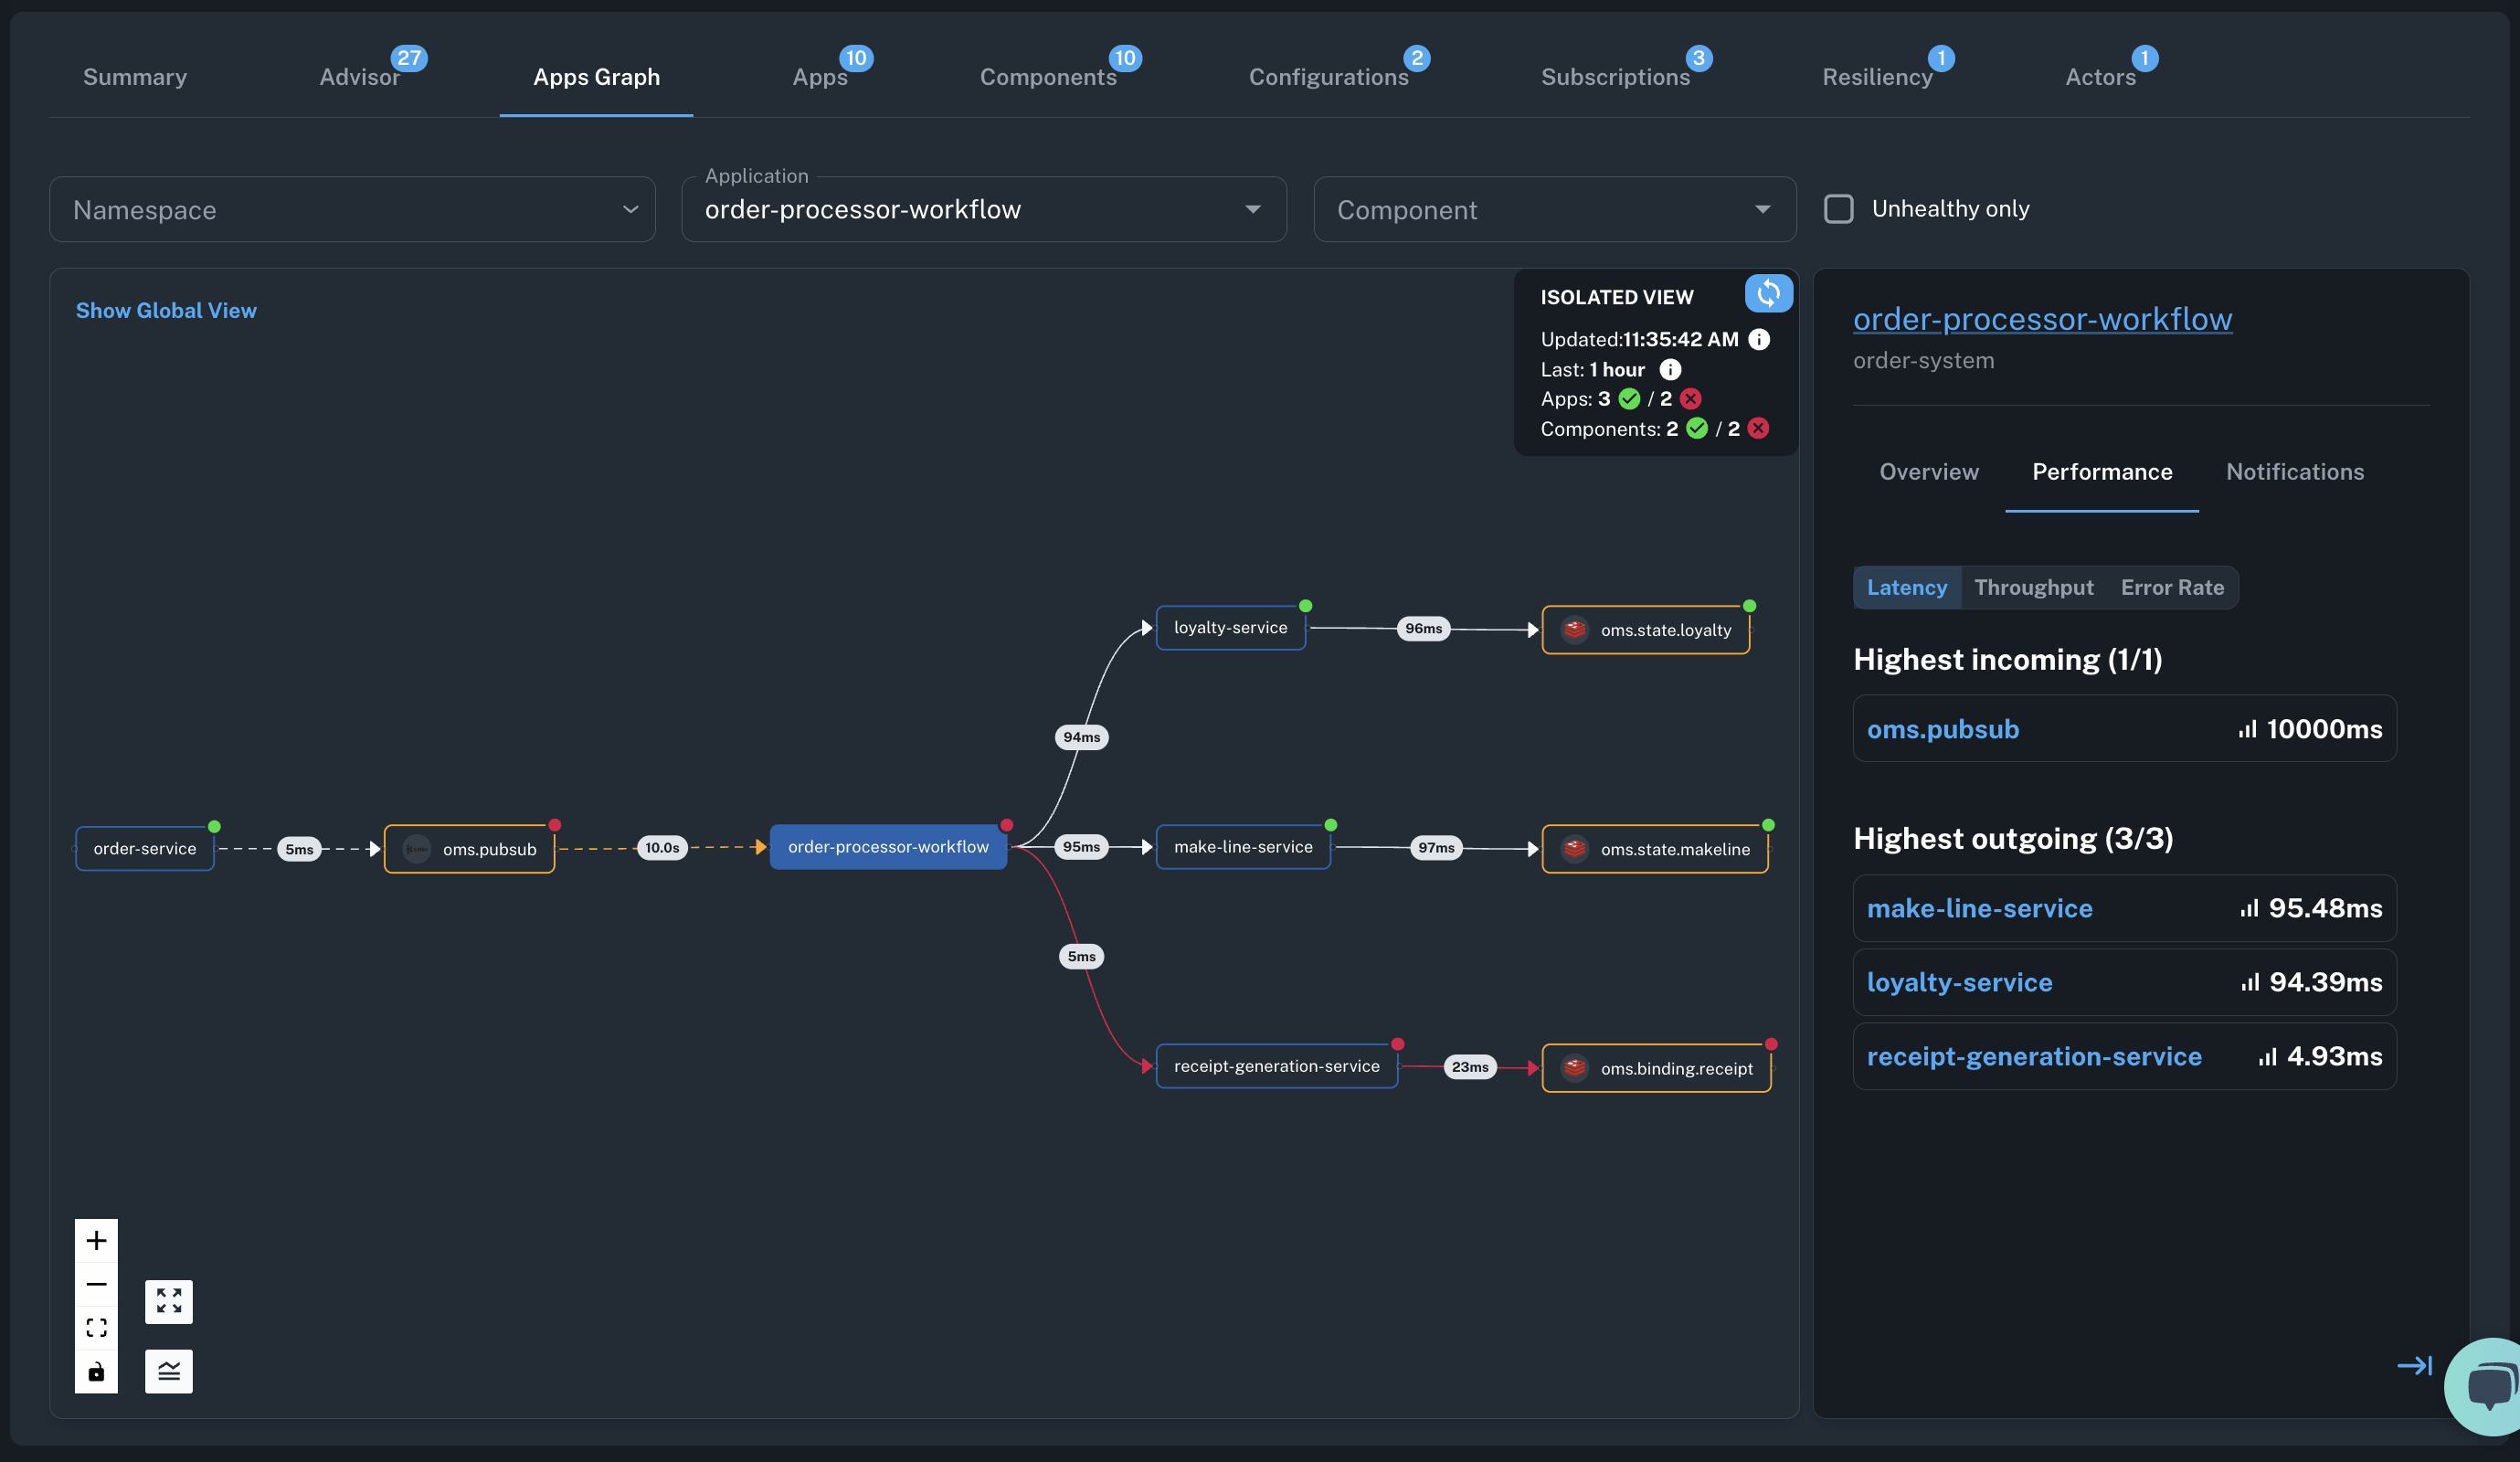
The Dapr Ops Dashboard (previously known as Diagrid Conductor) is a free SaaS tool that automates and manages Dapr deployments across your Kubernetes clusters, delivering operational excellence, security and reliability, and insights from development through production.
Automated operations
One-click installation, upgrades with automatic rollbacks, zero-downtime mTLS certificate rotation, and configuration synchronization keep Dapr up to date across all your clusters, with scheduled and canary updates for zero downtime.
Advisor: discover and apply best practices
Continuous checks against 50+ production standards catch security misconfigurations and optimization opportunities before they reach production.
Deep observability
150+ metrics with 20+ built-in dashboards, component health checks, actor metrics, plus a dynamic application graph that visualizes your services and infrastructure components. Export metrics to Grafana through the metrics API.
Alerts and notifications
Custom alerts with email and webhook notifications let your team respond to issues before they impact users.
Multi-cluster management and security
Manage multiple clusters from a single web console, with cluster-level RBAC, audit logs, and a Kubernetes operator for GitOps automation.
Resource usage reporting
Recommendations based on past resource behavior lead to significant CPU and memory cost savings.
Runs on any Kubernetes
Works with managed Kubernetes (AKS, EKS, GKE), on-premises distributions (OpenShift, Rancher, vanilla Kubernetes), and local clusters (Kind, Minikube, Docker Desktop).