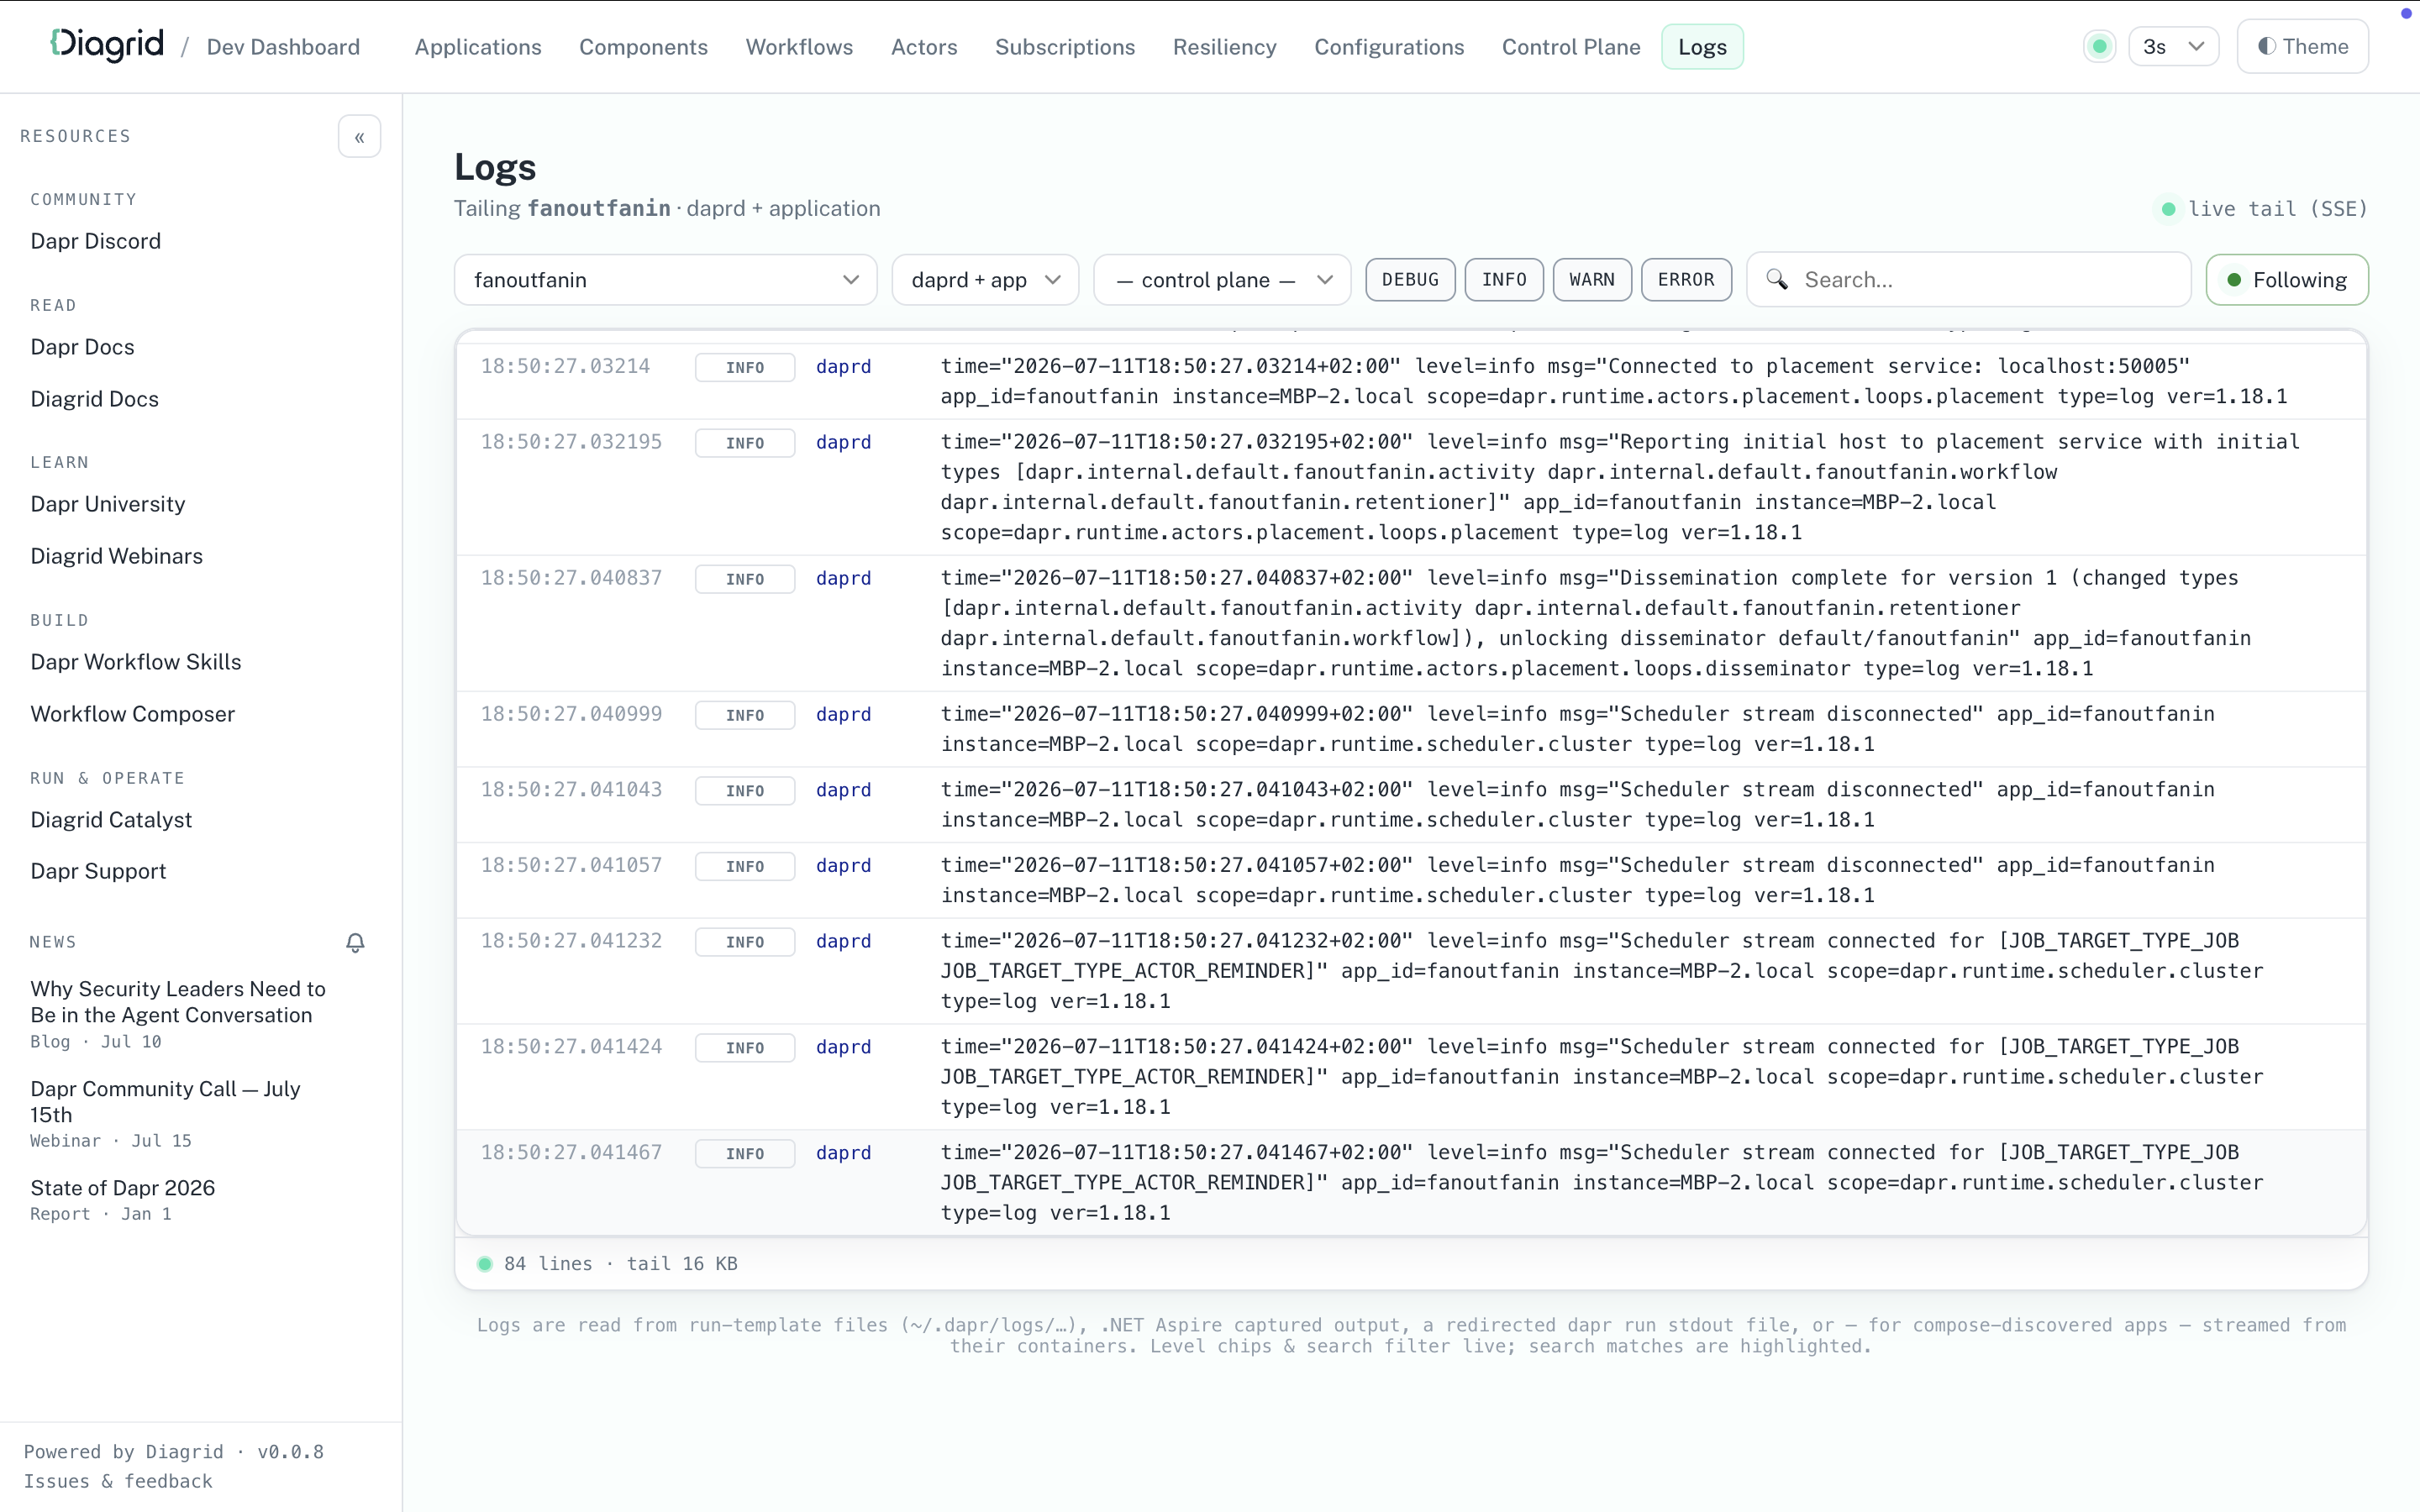
Dapr Dev Dashboard
The free Diagrid Dapr Dev Dashboard is a companion for local Dapr development. It inspects the apps you start with dapr run / dapr run -f, Aspire, Docker Compose, or Dapr Testcontainers, and surfaces everything about them: sidecars, workflows, actors, state stores, subscriptions, components, resiliency policies, configurations, and logs. It also helps you author Dapr resources. The Component Builder walks you through picking a component type from the full Dapr catalog, filling in its metadata fields, and choosing an authentication profile. The Resiliency Builder composes resiliency policies (timeouts, retries, circuit breakers) and applies them to targets (apps, actors, components). Both builders end in a YAML preview you can copy or download into your project.
Note
The Dev Dashboard is a local development tool only. It is not intended to run inside a Kubernetes cluster, or in production, staging, or any shared environment.Install the Dev Dashboard
The dashboard ships as a standalone binary that is published on GitHub Releases. Download and install the dashboard via the terminal:
The script installs the dashboard to ~/.local/bin.
curl -sSL https://raw.githubusercontent.com/diagridio/dev-dashboard/main/scripts/install.sh | sh
To install a specific version, set VERSION before piping:
curl -sSL https://raw.githubusercontent.com/diagridio/dev-dashboard/main/scripts/install.sh | VERSION=vX.Y.Z sh
The script installs the dashboard to %LOCALAPPDATA%\Programs\diagrid-dev-dashboard.
iwr -useb https://raw.githubusercontent.com/diagridio/dev-dashboard/main/scripts/install.ps1 | iex
To install a specific version, set VERSION before piping:
$env:VERSION='vX.Y.Z'; iwr -useb https://raw.githubusercontent.com/diagridio/dev-dashboard/main/scripts/install.ps1 | iex
If the install directory is not on your PATH, the script prints the line you need to add.
Alternatively, download the archive for your platform from the GitHub Releases page, extract it, and place diagrid-dev-dashboard (or diagrid-dev-dashboard.exe) on your PATH.
Verify the installation with:
diagrid-dev-dashboard --version
Run the Dev Dashboard
Start the dashboard with:
diagrid-dev-dashboard
The dashboard opens in a browser at http://localhost:9090. Use the --port flag to run the dashboard on a different port:
diagrid-dev-dashboard --port 8080
No additional setup is needed. The dashboard discovers running Dapr apps the same way dapr list does, so anything started with dapr run / dapr run -f, Aspire, Docker Compose, or Dapr Testcontainers shows up within one refresh cycle.
Update the Dev Dashboard
On startup, the dashboard checks for a newer release. When one is available, the dashboard prints a notice and the UI shows an Update available indicator. To update to the latest release, run:
diagrid-dev-dashboard update
Restart any running dashboard to use the new version.
Features
Inspect applications
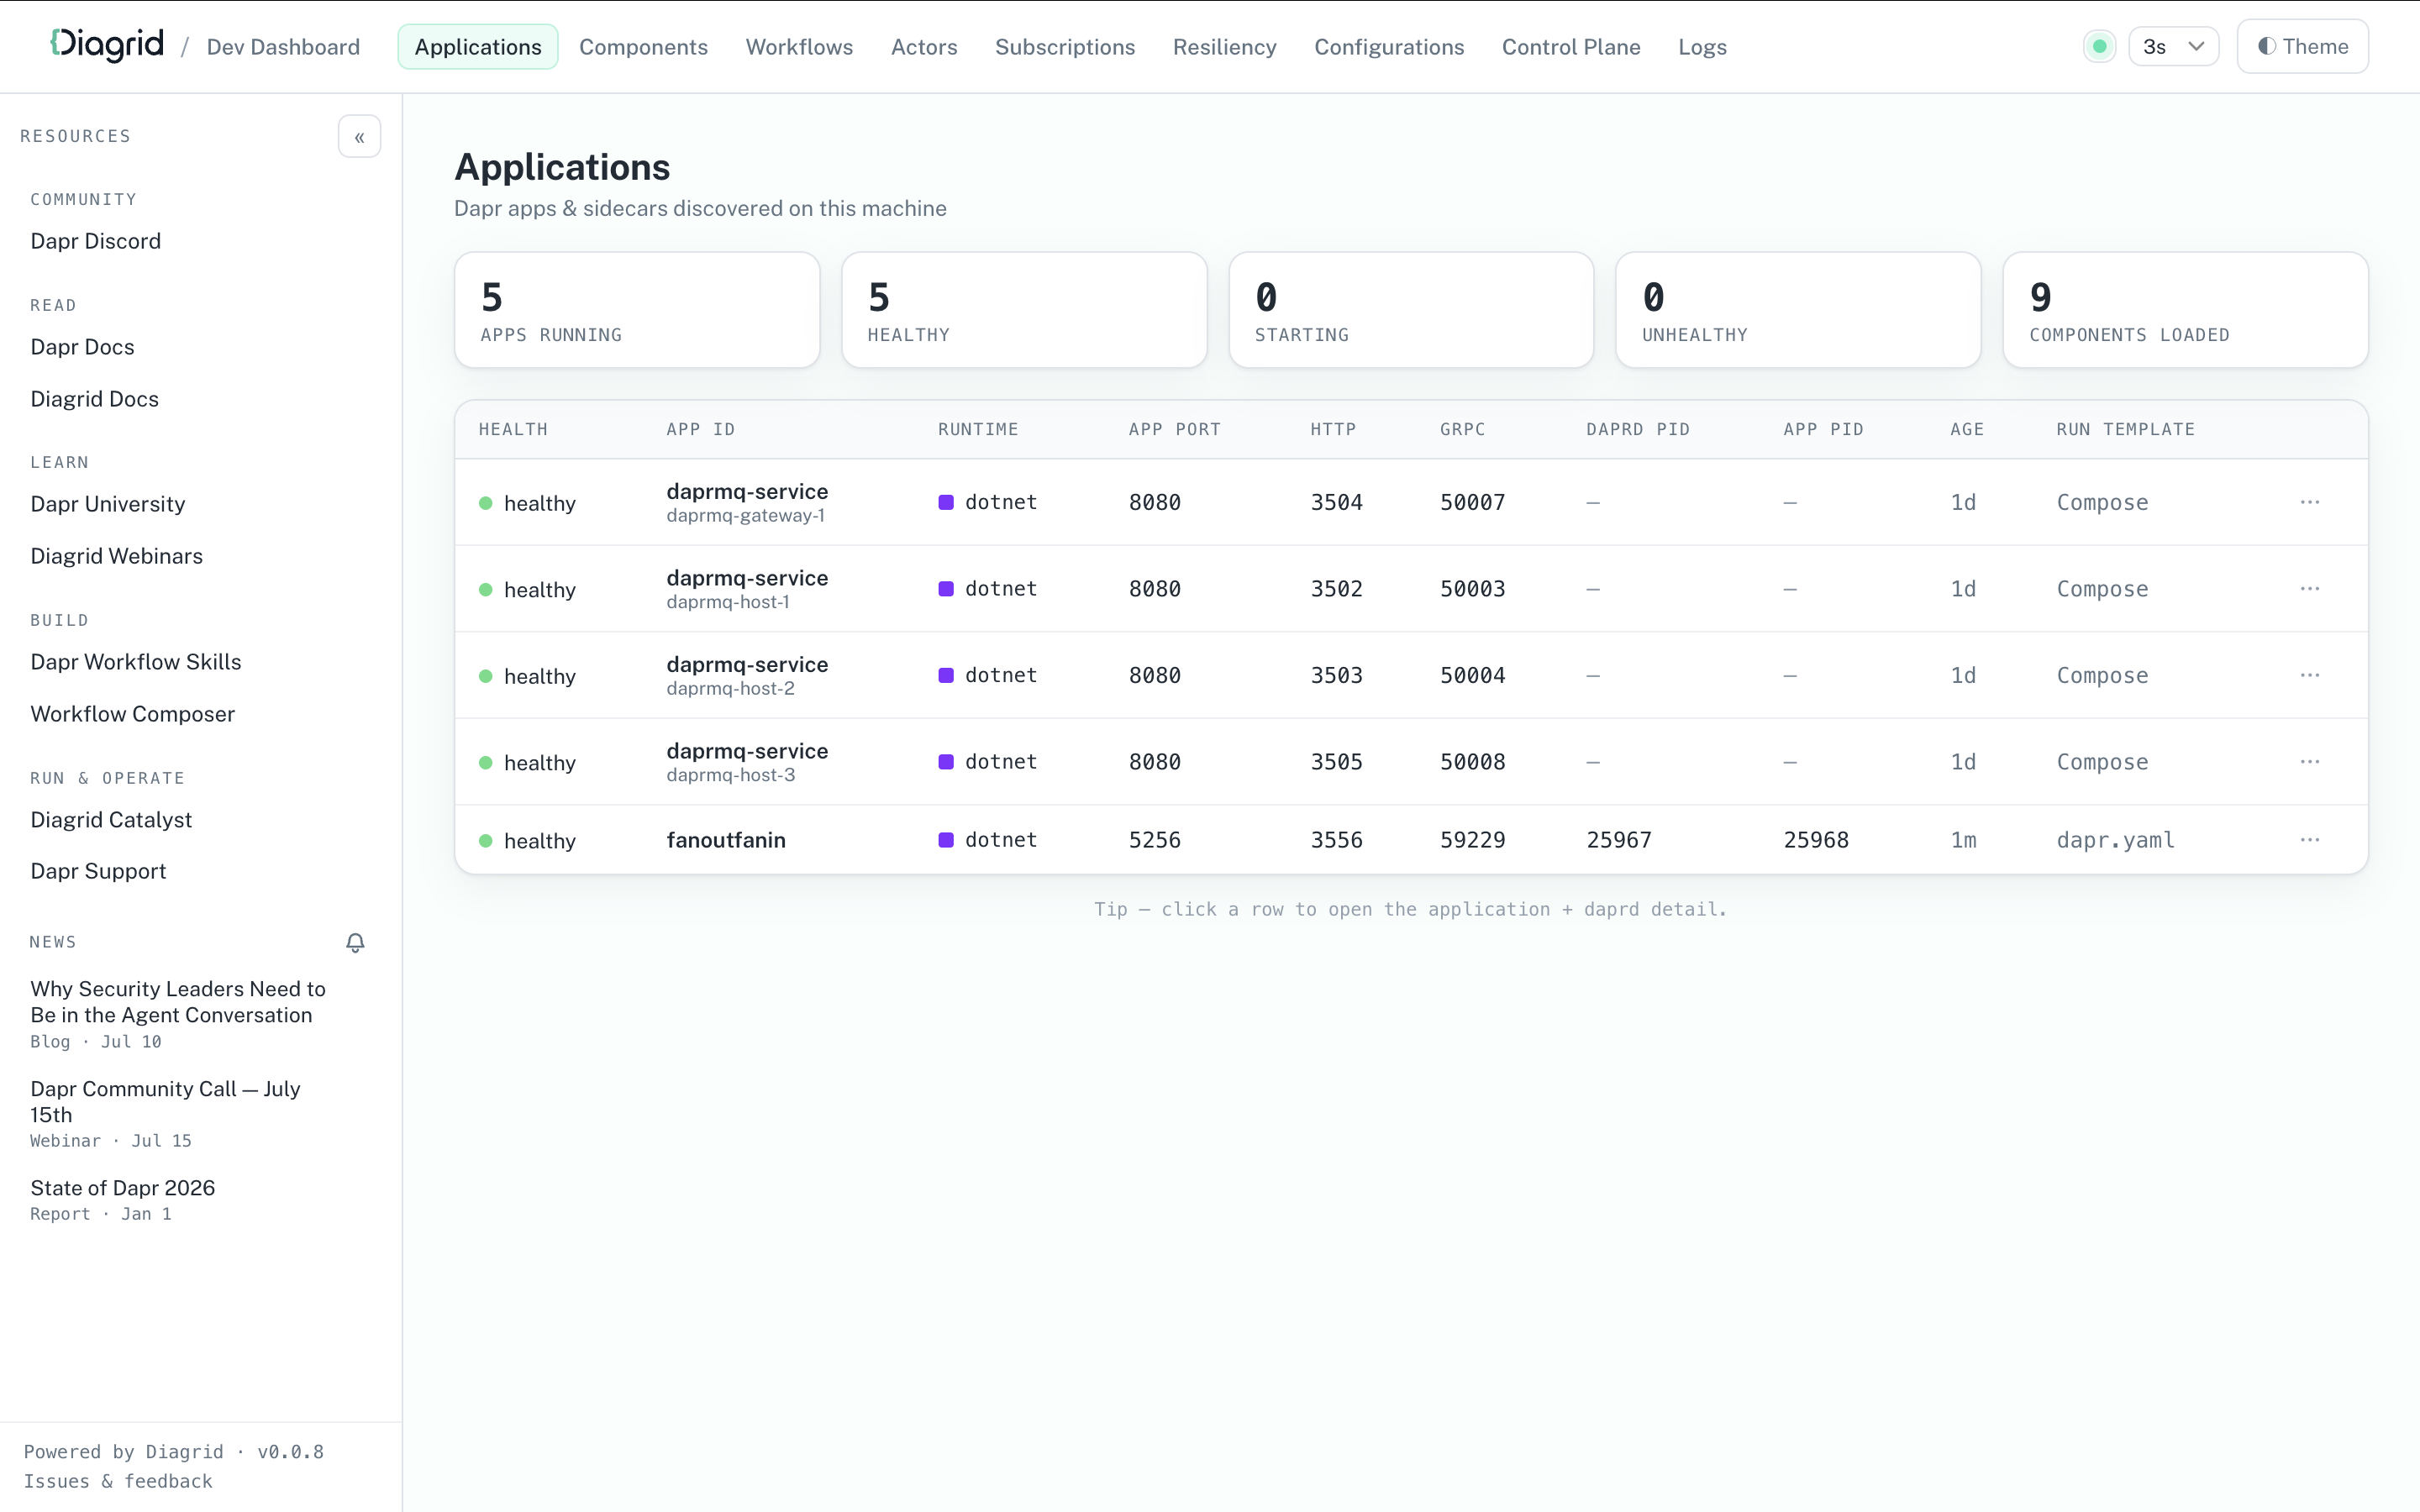
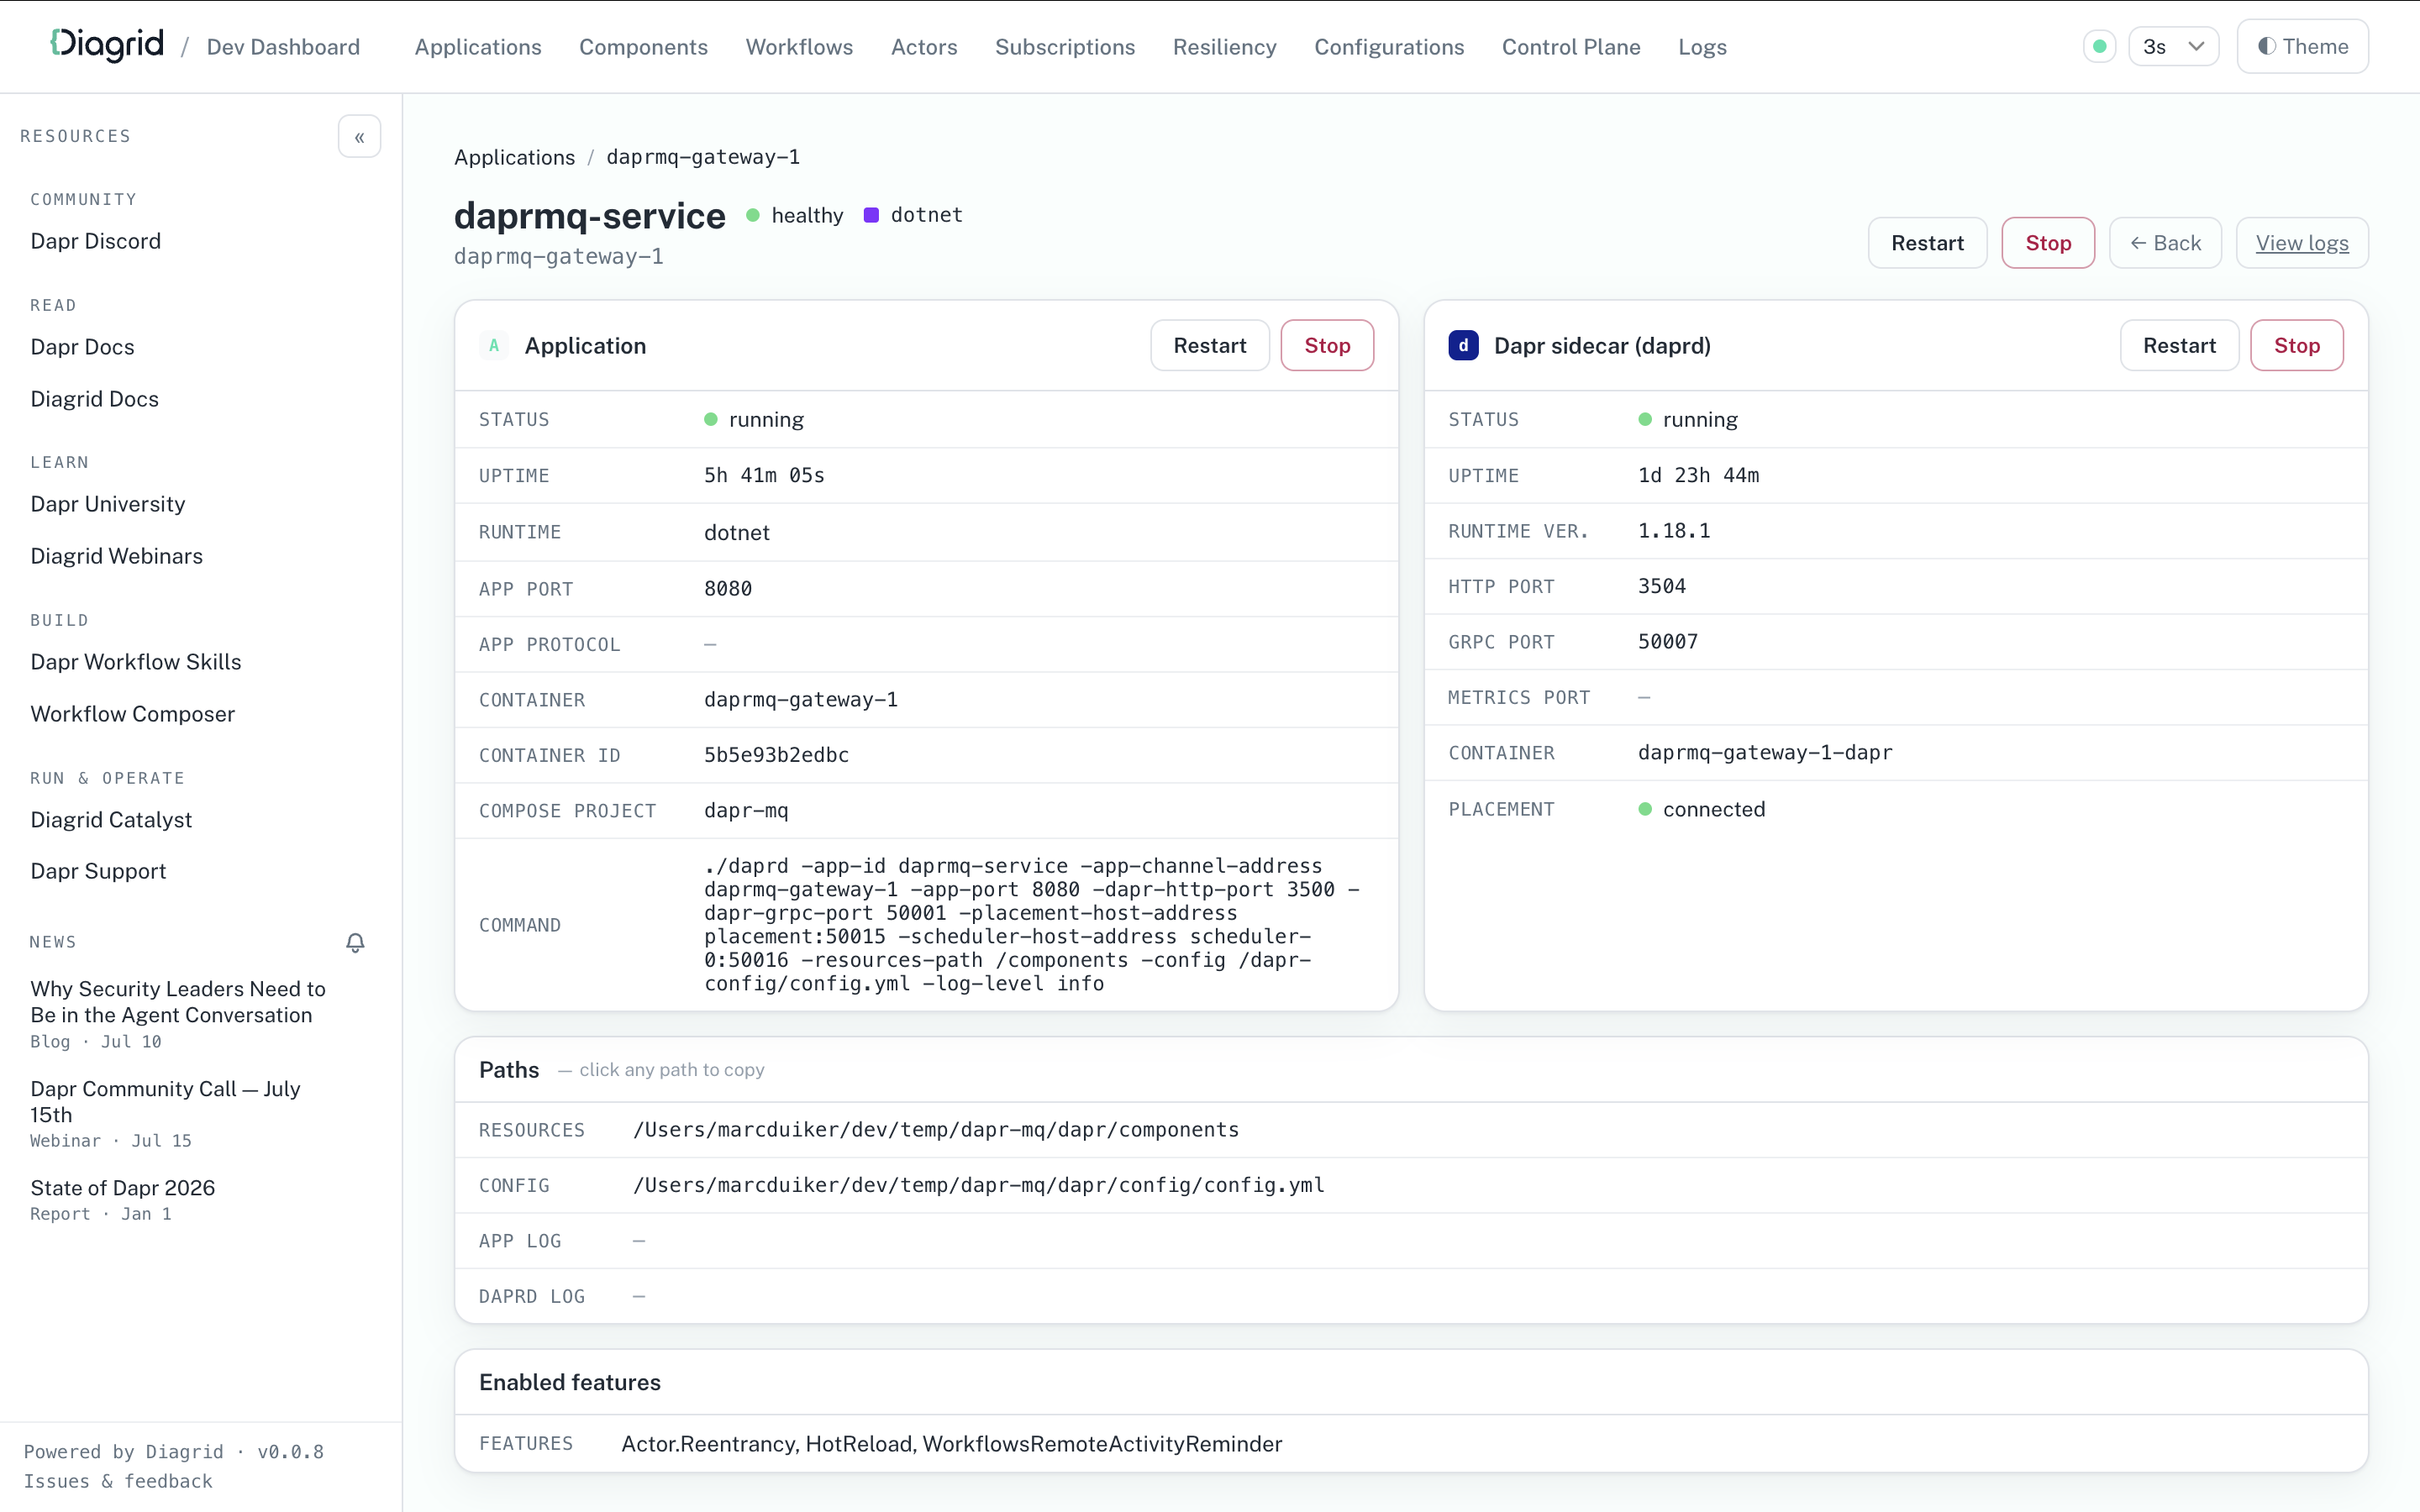
The Applications page shows a live table of all running apps and sidecars, including the app ID, health, runtime, ports, and process IDs. Drill into a single app to see its command, resource and configuration paths, runtime metadata, enabled features, and loaded components.
Debug workflows
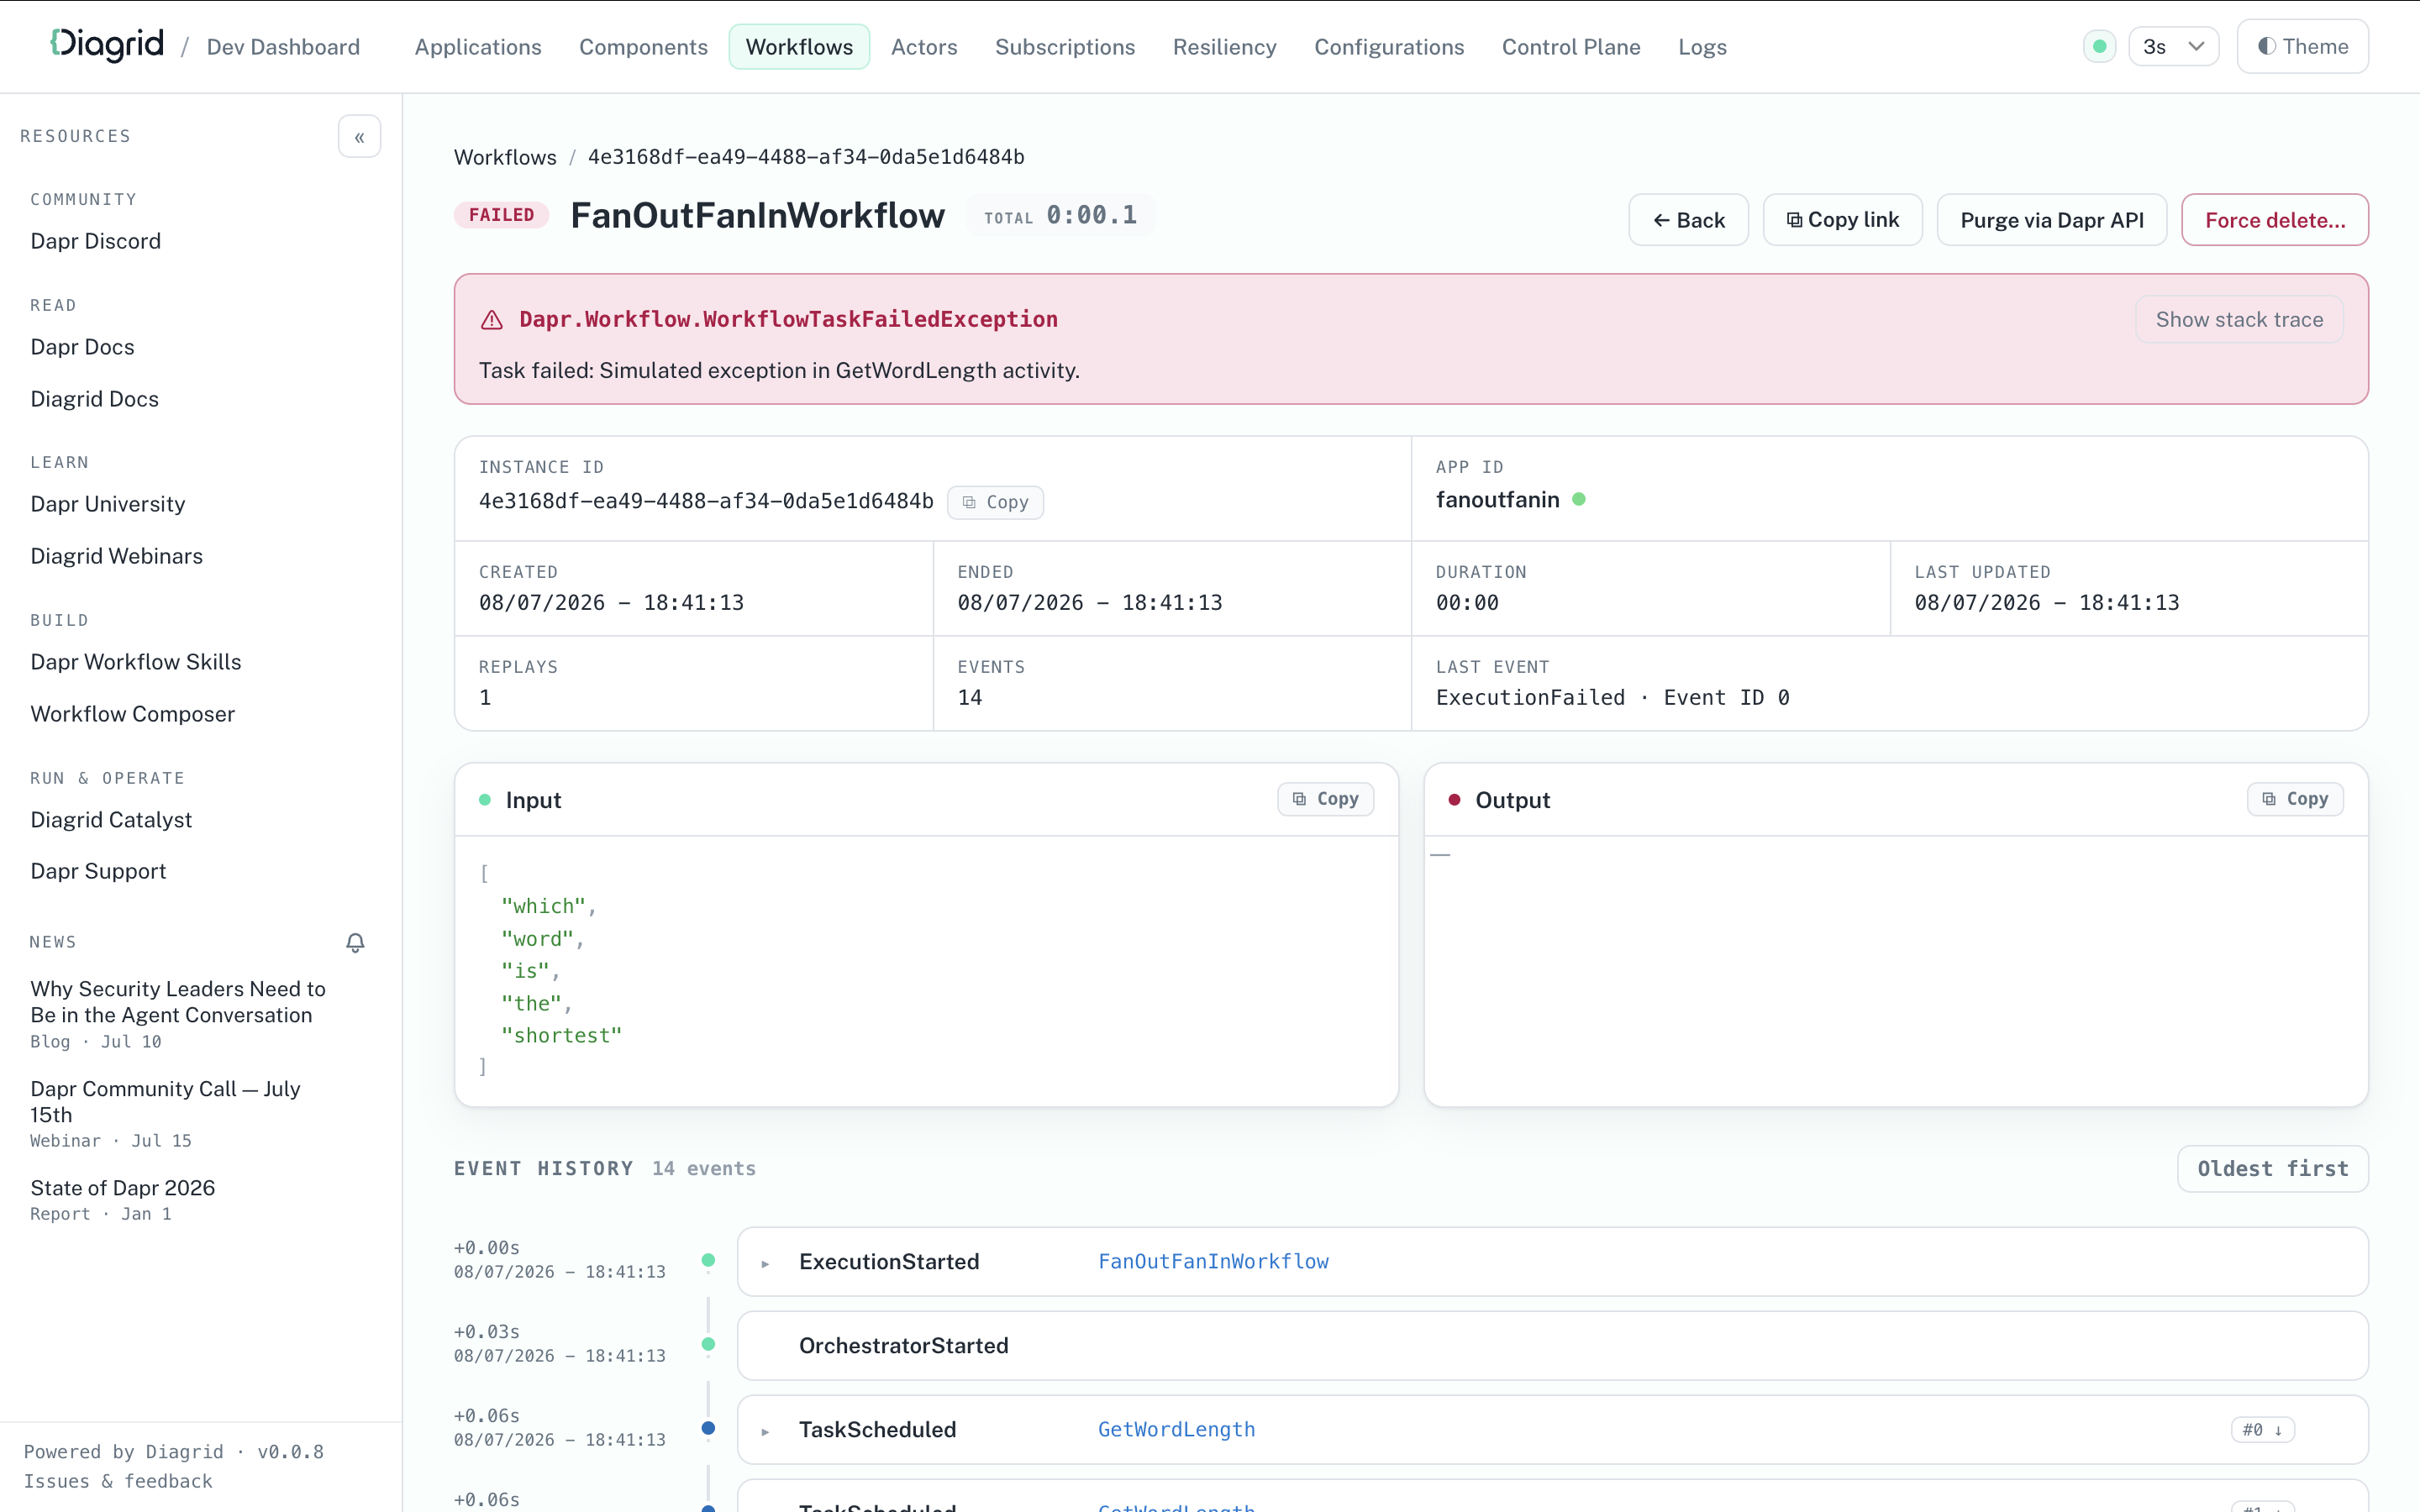
The Workflows page lists the workflow executions across all apps, with status filters and search. You can terminate and purge individual workflows or bulk-delete them.
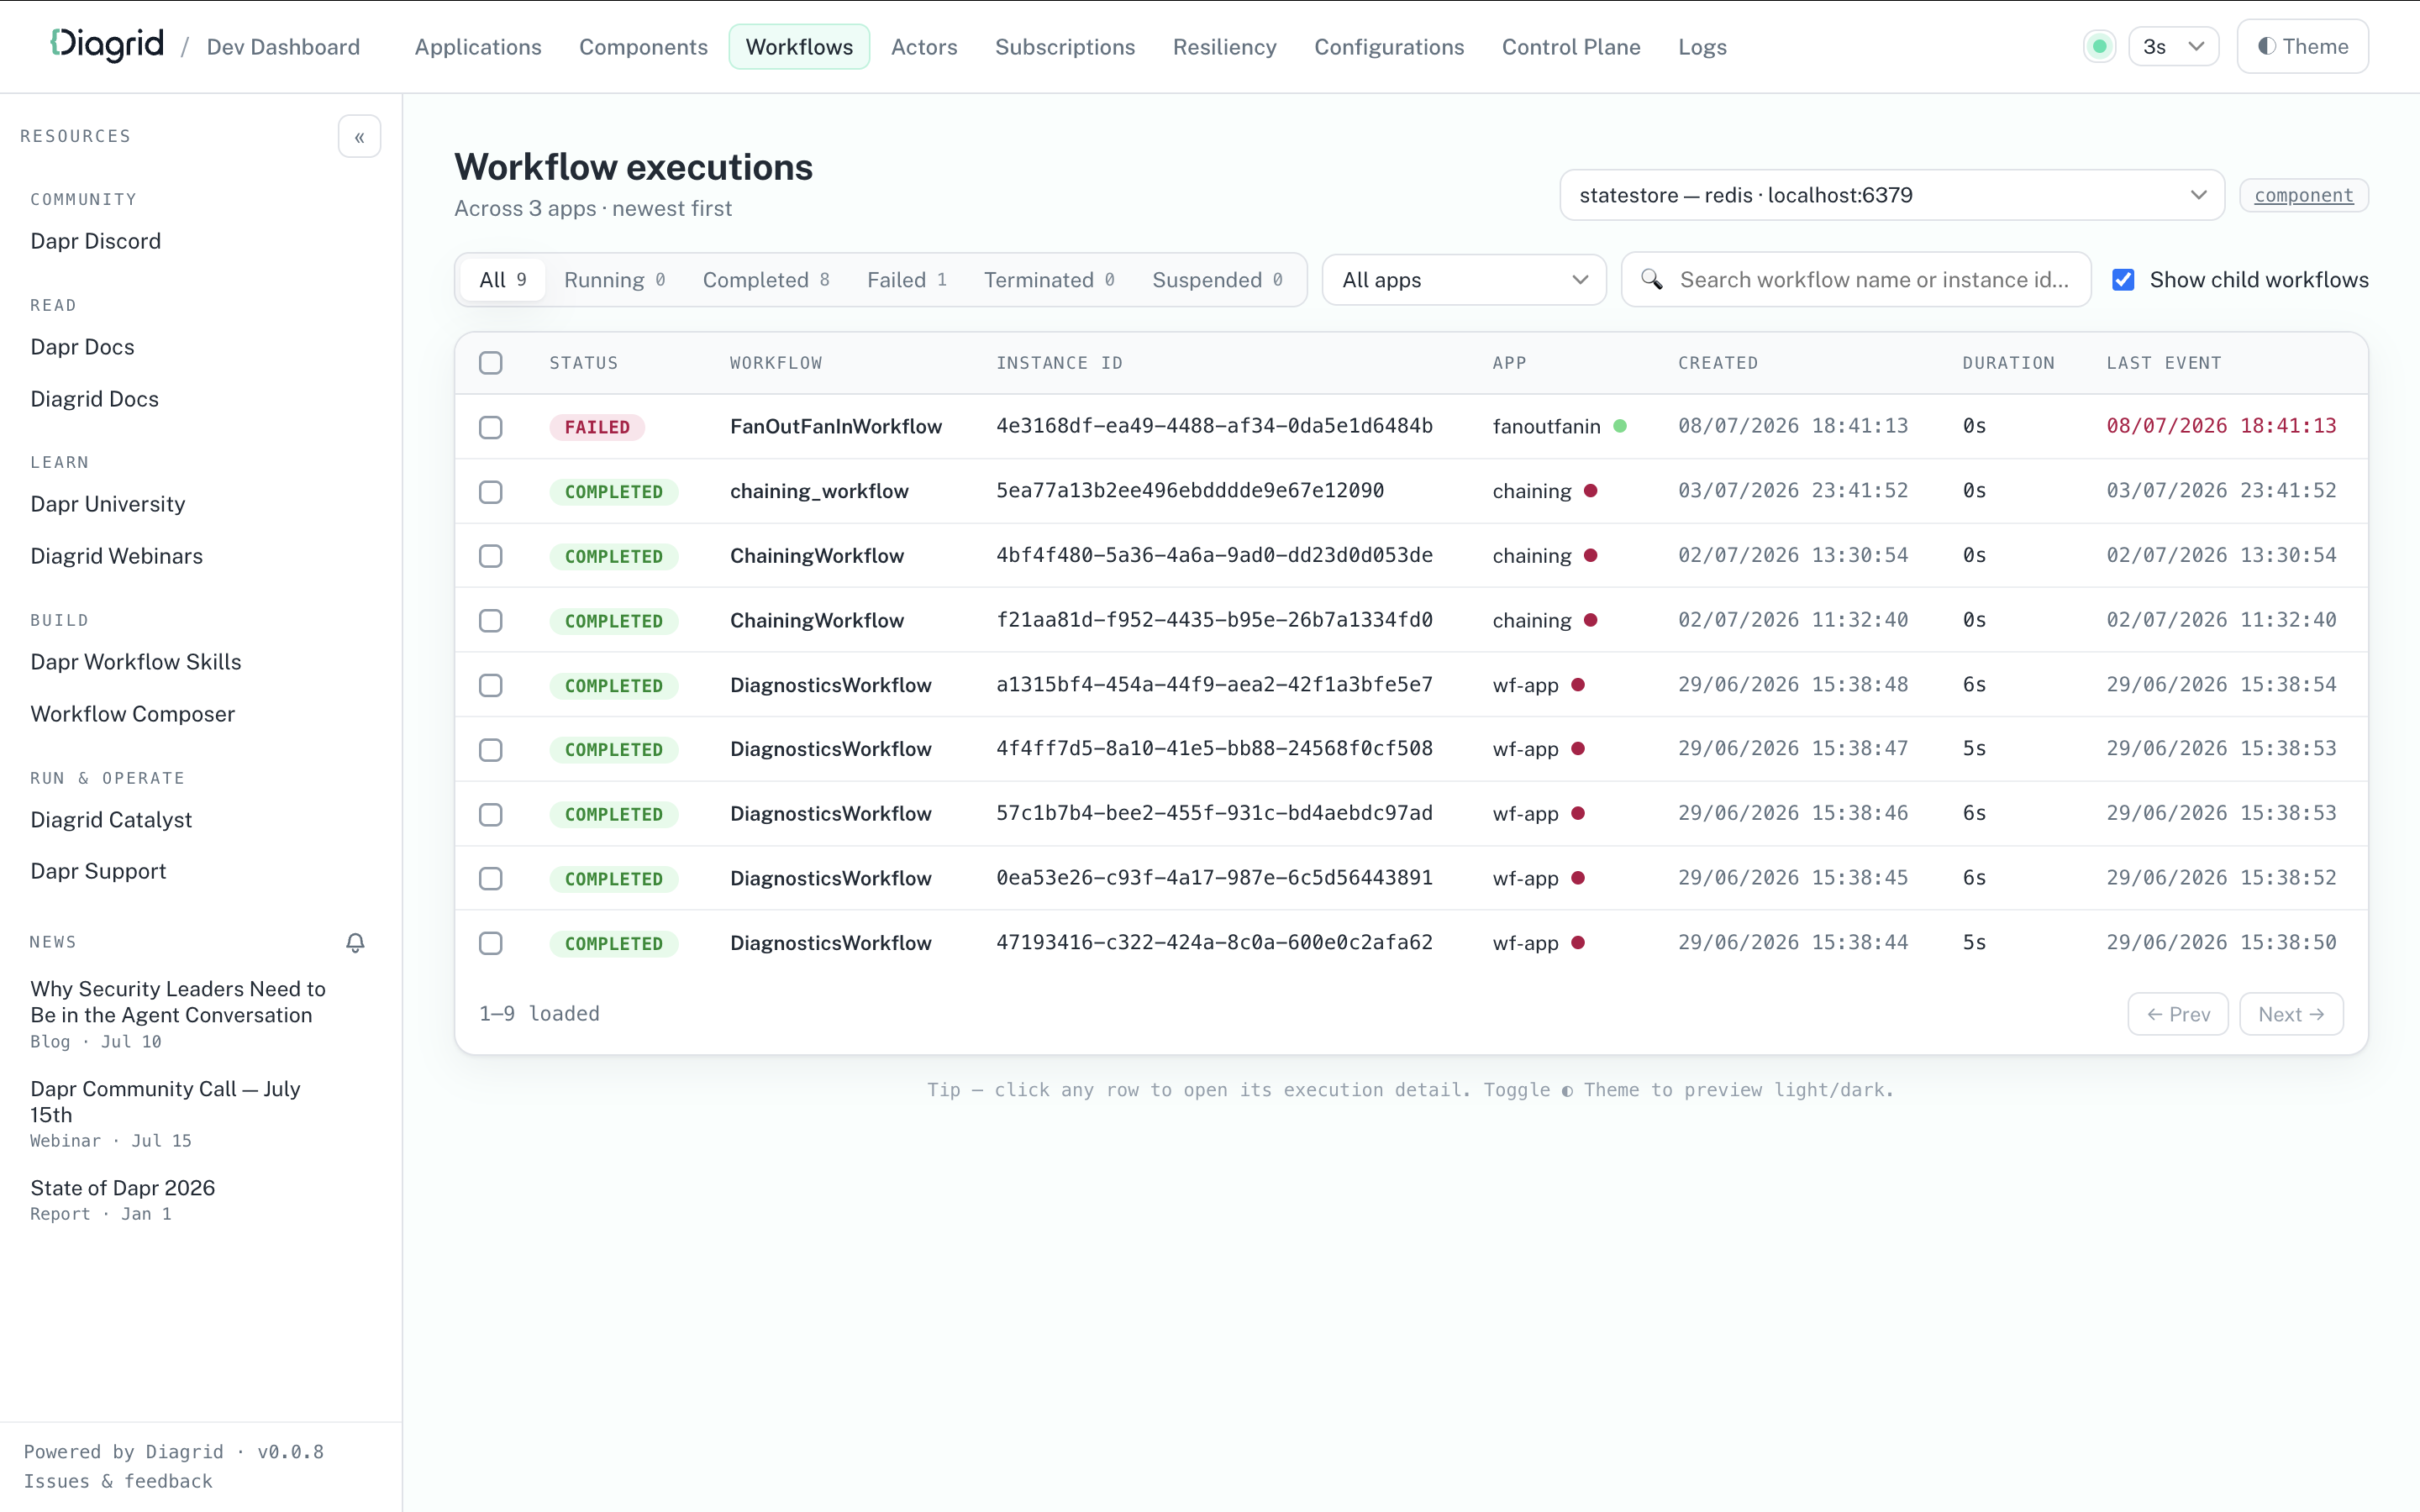
Open a workflow instance to watch its live event history, input and output, and custom status.
Review actors, subscriptions, and state
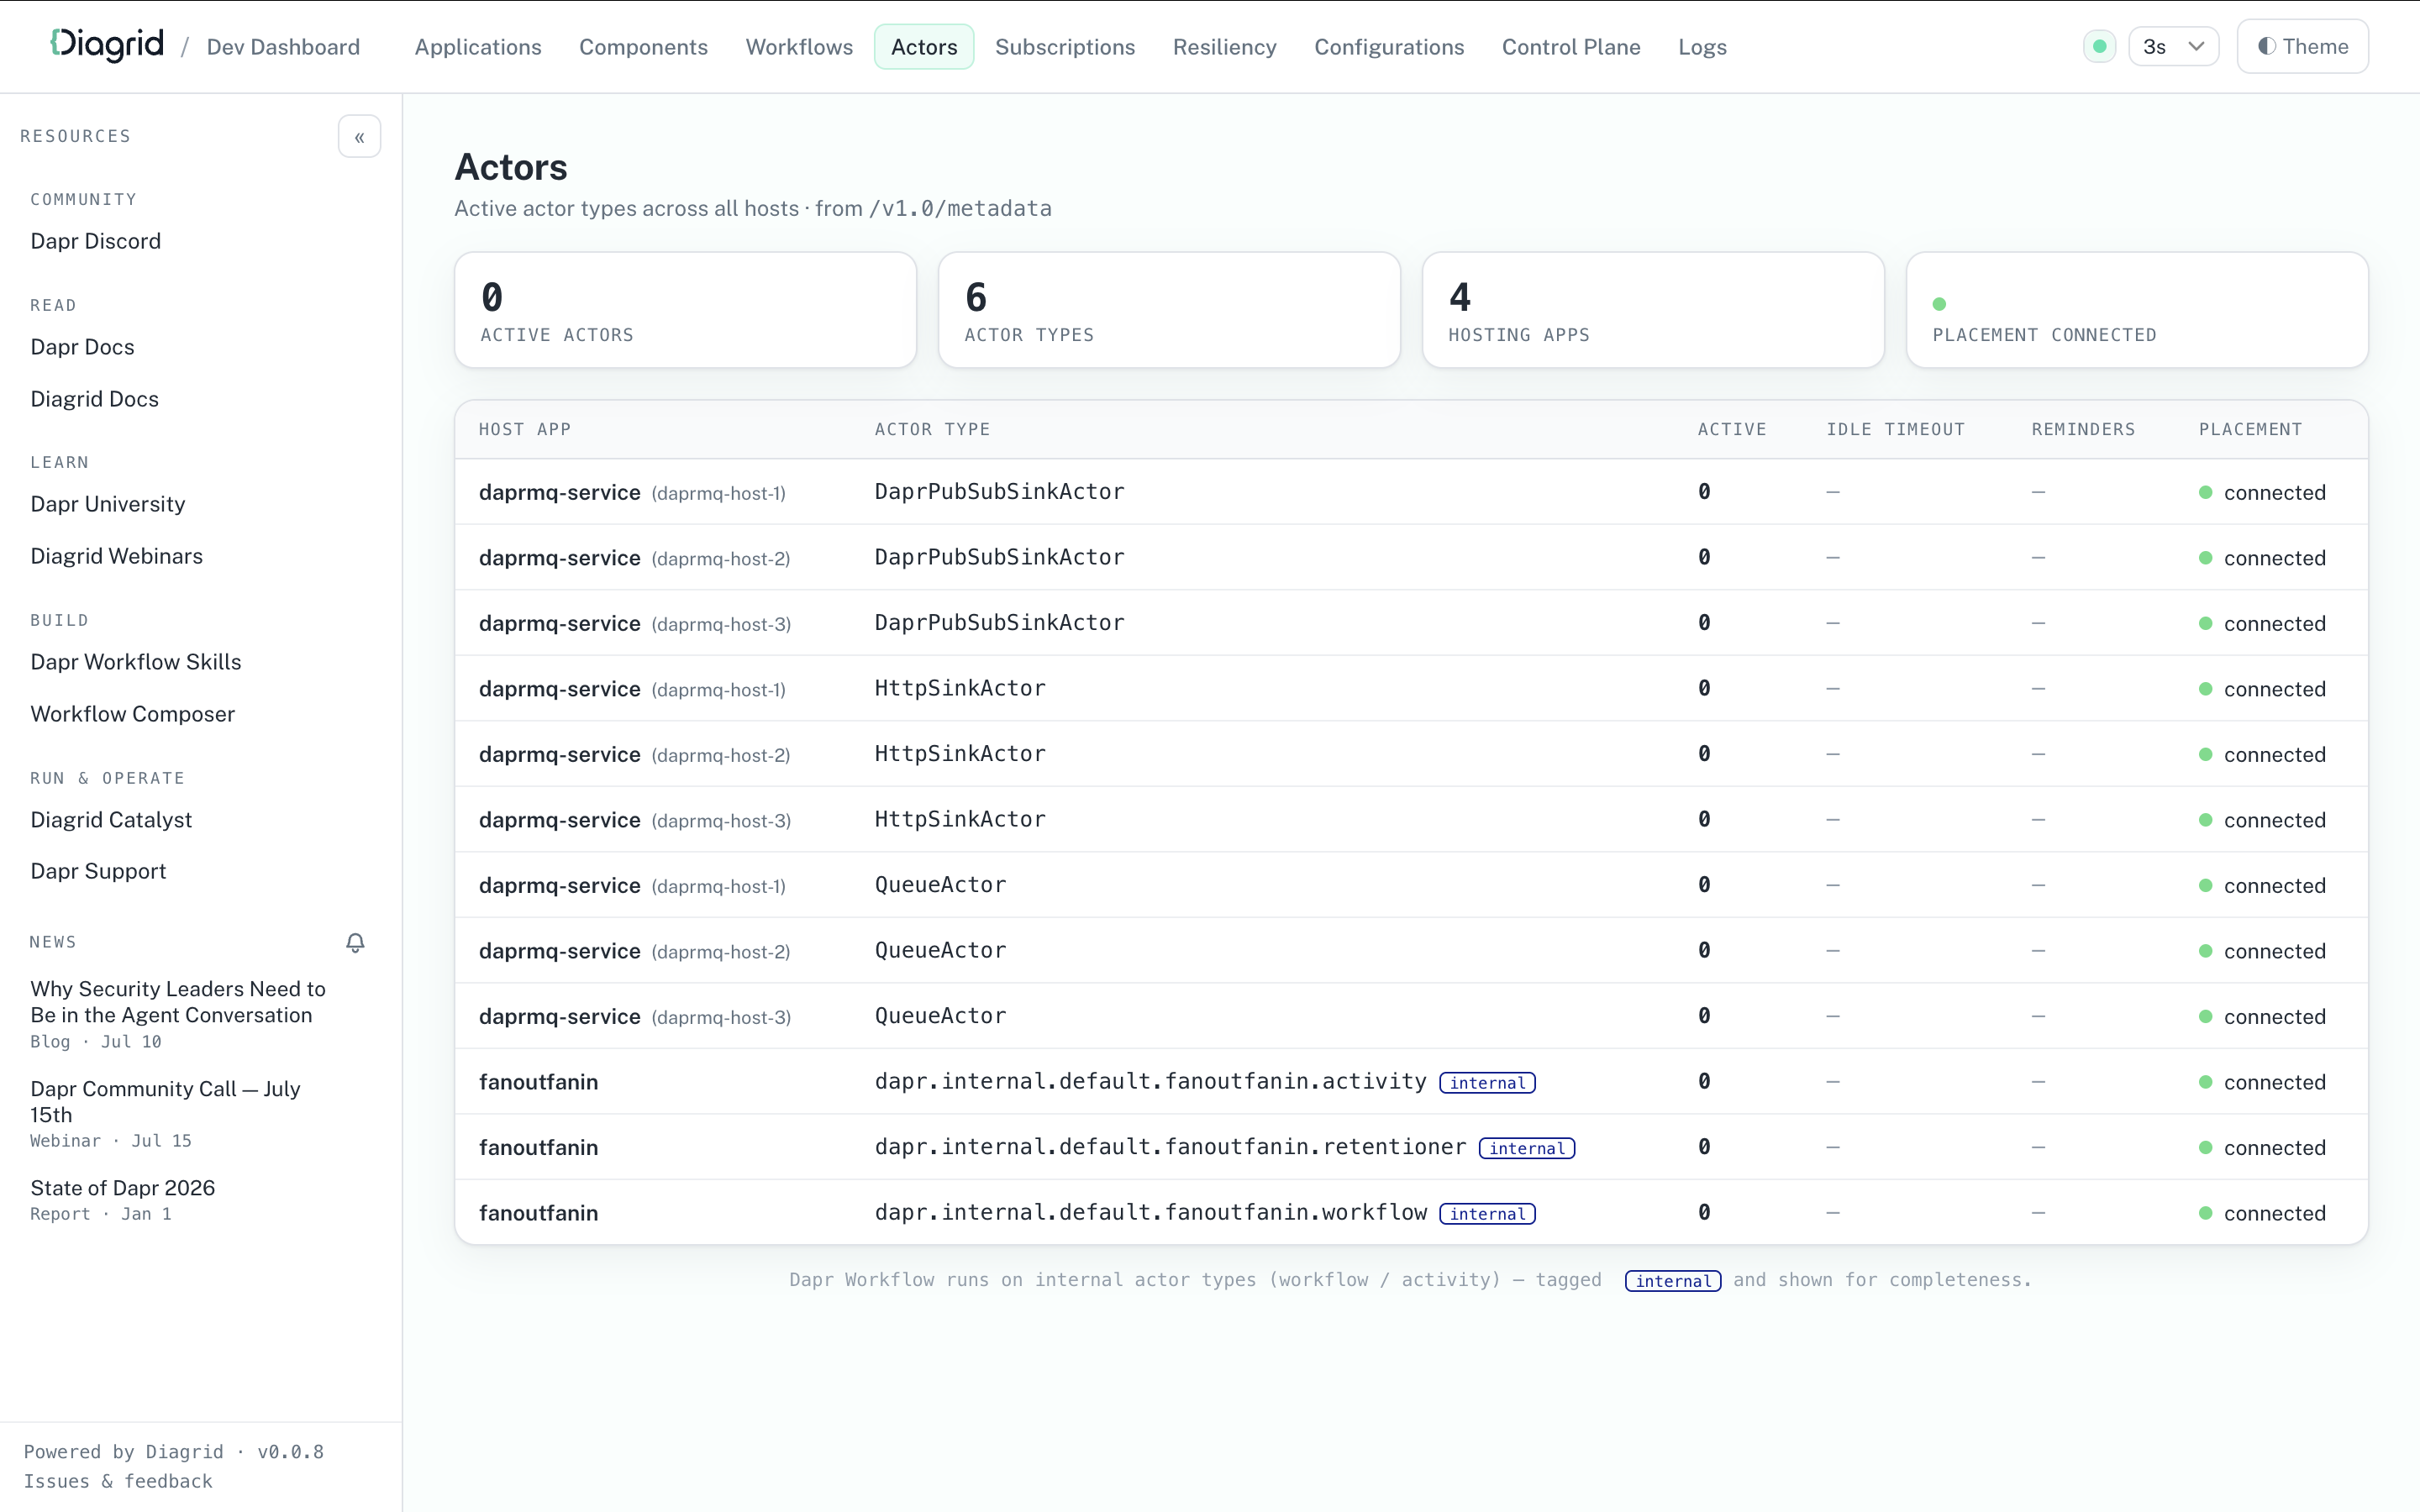
The Actors and Subscriptions pages aggregate the active actor types and pub/sub subscriptions across all apps, each linked back to the owning application. The State page lists the records in a connected state store, and lets you add and delete records.
Read and build components
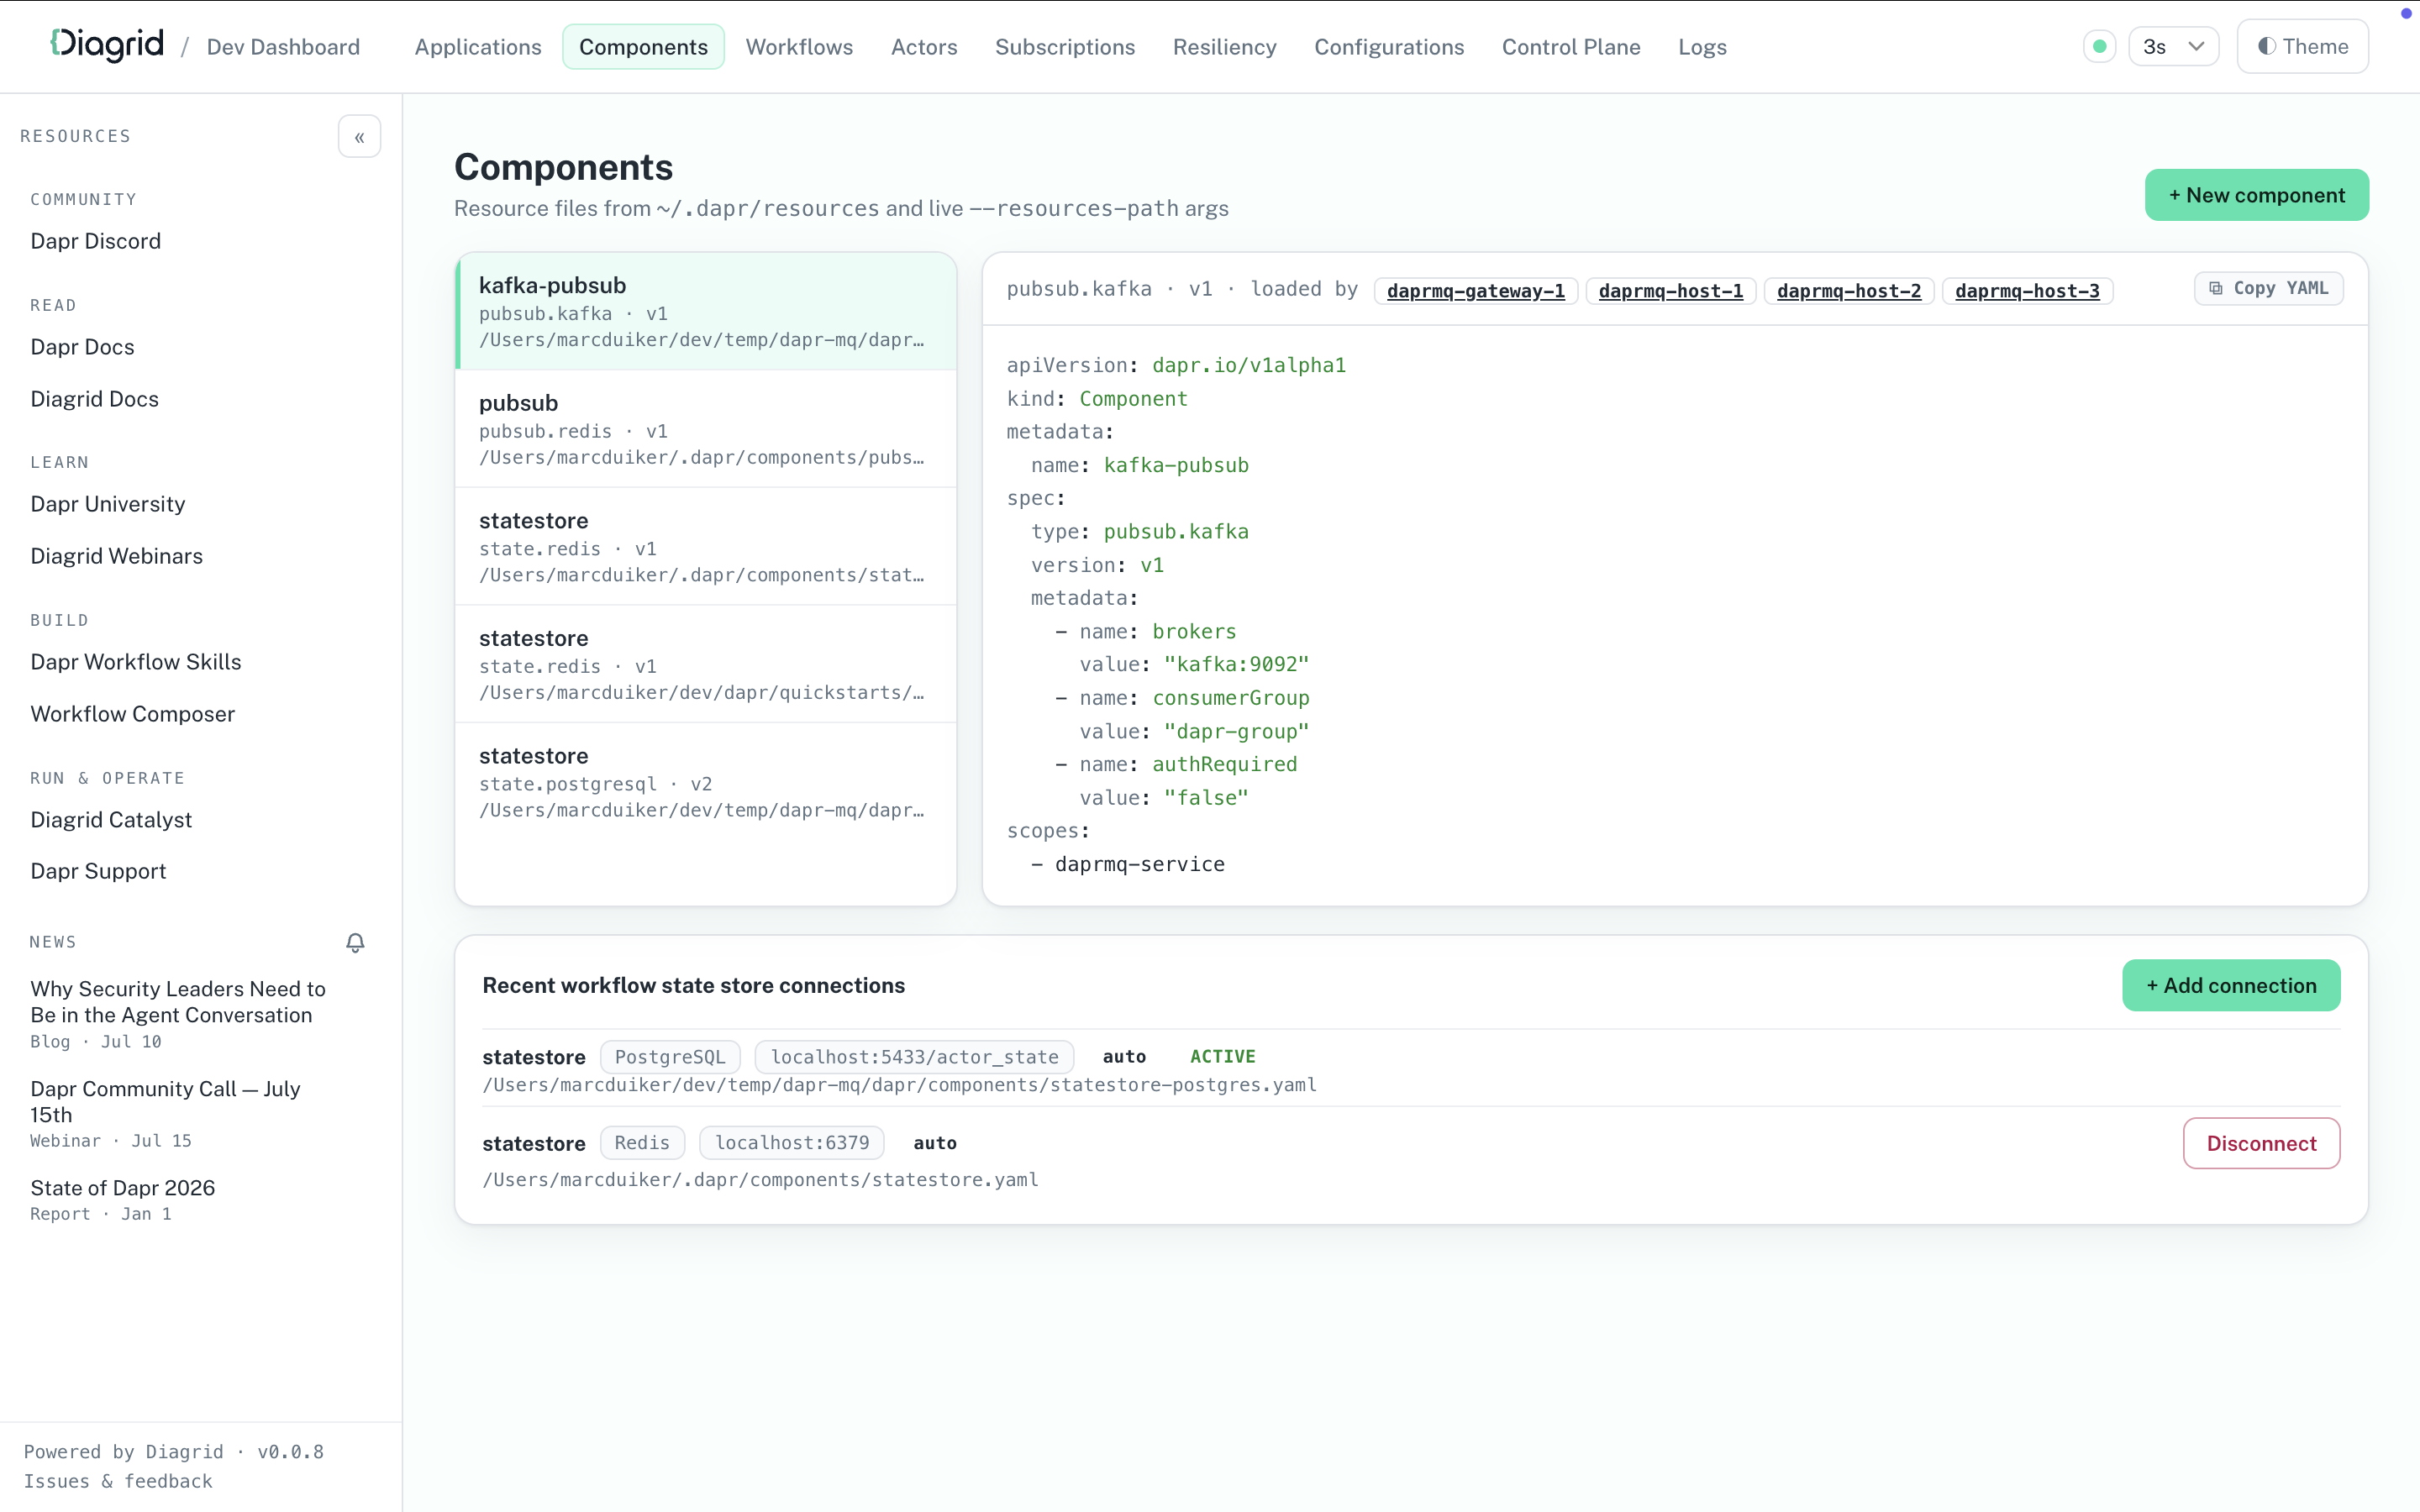
The Components page shows the component files and which apps loaded each component. Use the + New component button to open the Component Builder and generate component YAML for any component type in the Dapr catalog. The Resiliency page offers a similar builder for resiliency policies.
Check the control plane
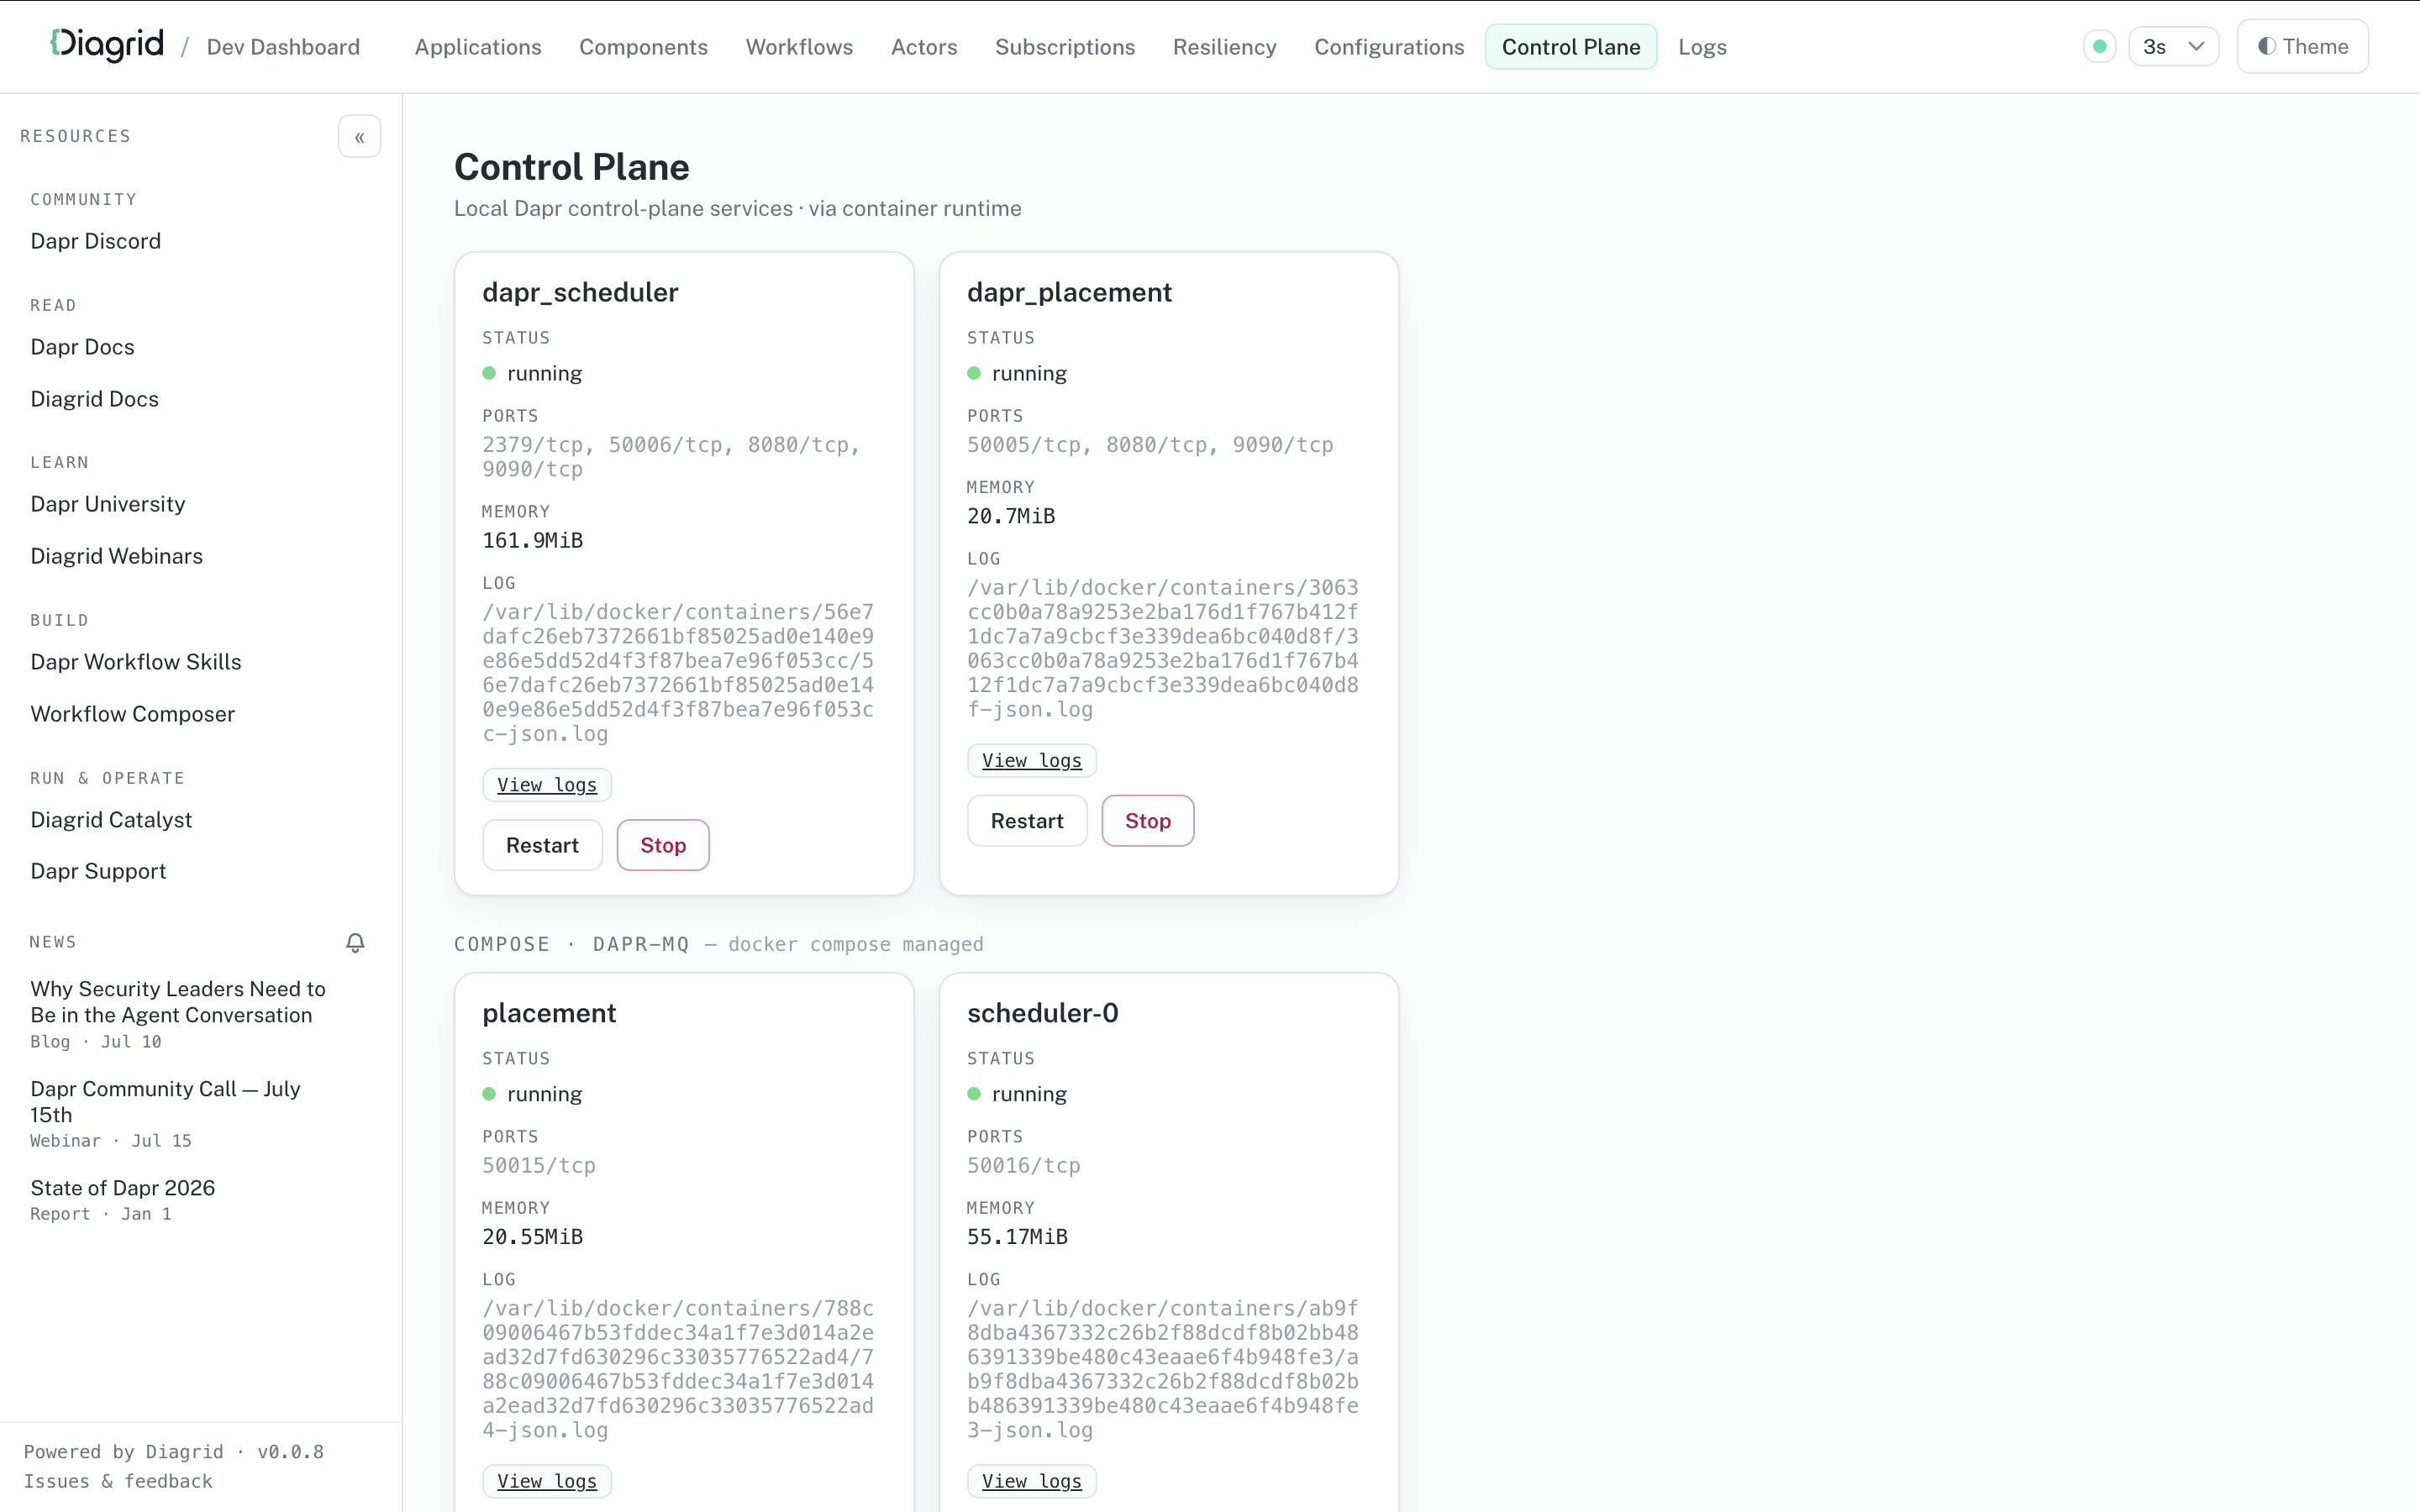
The Control Plane page shows the status, ports, and memory usage of the local Dapr control plane services, such as the scheduler and placement services, and lets you restart or stop them.
Stream logs
The Logs page streams the daprd and application logs per app, with level coloring, keyword highlighting, and a follow toggle.